home | copyright ©2016, tim@menzies.us

overview |
syllabus |
src |
submit |
chat
- What is the connection between discretization and explanation?
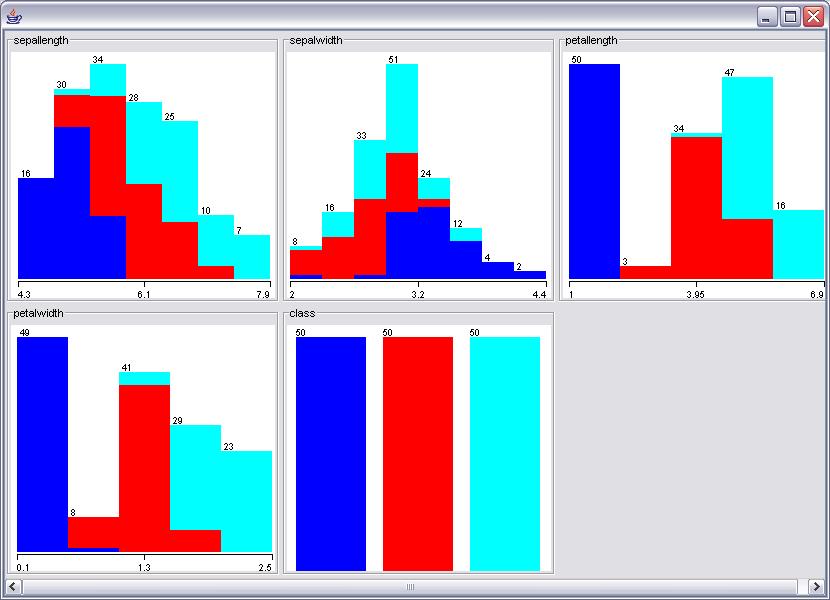
- In the following diagram, - Where are two examples of ranges where the independent values change the default class distribution? - Propose, and defend, two useful breaks in the following independent variables:
Consider the following example:
0,0,0,0,0,0,0,0,1,1,1,1,1,1,1,2,2,2,2,3,4,5,10,20,40,80,100
- Define and distinguish EqualIntervalDiscretization (EID) from EqualFrequencyDiscretization (EFD)
- Using the above data, show EID and EFD for 10 bins
- Using EID and EFD and 10 bins, the above eample has several problems. List them.
- What extra information is used by supervised discretization over unsupervided discretization?
- Explain: supervised discretization works by finding ``cliffs''.
- Where are the ``cliffs'' in the following data (explain all your working): (1.0,A), (1.4,A), (1.7, A), (2.0,B), (3.0, B), (7.0, A),
- Suppose a column of numbers has no cliffs. What does that mean about those numbers.
- How can entropy or standard deviation amongst the class variable be used to find ``cliffs''? - What kind of class variable would be needed for entropy-based cliffs? - What kind of class variable would be needed for standard deviation-based cliffs?
- Gama and Pinto's PID algorithm uses two layers. - What is the connection between the upper and lower layer? - What is the size and purpose and use of the upper layer? - What is the size and purpose and use of the lower layer?
- How can incremental discretization be used for anomaly detection?
- What is Cohen's rule and how is it calculated?
- Given the lower and upper end of a bin, when is the bin too small?
- What is a blunt/sharp range?
- What is a relevant range?
BTW, here are some notes I should have shown last week.
Assume that a column of numbers comes from a Gaussian distribution.
Normalize all numbers by subtracting the mean and dividing by the standard deviation (which means the resulting numbers have a mean of zero and a standard deviation of one).
Then divide the numbers according to the desired number of bins using breaks take from the following table.
  bins                        breaks
  ---- -------------------------------------------------
  2:                           0
  3:                     -0.43   0.43
  4:                     -0.67 0 0.67
  5:               -0.84 -0.25   0.25 0.84
  6:               -0.97 -0.43 0 0.43 0.97
  7:         -1.07 -0.57 -0.18   0.18 0.57 1.07
  8:         -1.15 -0.67 -0.32 0 0.32 0.67 1.15
  9:   -1.22 -0.76 -0.43 -0.14   0.14 0.43 0.76 1.22
  10:  -1.28 -0.84 -0.52 -0.25 0 0.25 0.52 0.84 1.28