


Photometric datasheet generator (HTML + PDF) from EULUMDAT .ldt files — orchestrates the full eulumdat-* ecosystem.
- Single-page A4 datasheet from any EULUMDAT
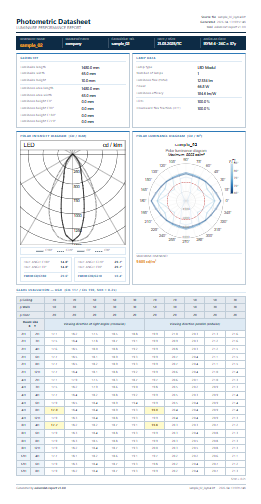
.ldtfile - Polar intensity diagram (cd/klm) —
eulumdat-plot - Polar luminance diagram (cd/m²) + maximum luminance —
eulumdat-luminance - UGR catalogue table (CIE 117 / CIE 190, 19 rooms × 5 reflectances × 2 directions) —
eulumdat-ugr - Numerical luminance table (cd/m²) — optional section in full report (
--lum-table) - Half-angles and FWHM per C-plane —
eulumdat-analysis - HTML output (self-contained, browser-ready A4 preview)
- PDF output via Playwright / Chromium (cross-platform — see installation notes)
- PNG export of UGR and luminance tables for Word / docxtpl integration
- Custom Jinja2 template support
- CLI and Python API
pip install eulumdat-reportPDF rendering uses Playwright (Chromium headless). After installing the package, download the Chromium browser once:
playwright install chromiumThis step is required on all platforms (Windows, Linux, macOS). HTML output works without it.
# HTML + PDF
eulumdat-report luminaire.ldt

# HTML only, custom output directory
eulumdat-report luminaire.ldt --no-pdf --output-dir reports/

# Include numerical luminance table
eulumdat-report luminaire.ldt --lum-table

# All options
eulumdat-report --helpfrom eulumdat_report.collector import ReportCollector
from eulumdat_report.renderer import ReportRenderer
from pathlib import Path
data = ReportCollector.collect("luminaire.ldt")
html = ReportRenderer.render_html(data)
Path("luminaire.html").write_text(html, encoding="utf-8")
# PDF (requires: playwright install chromium)
ReportRenderer.render_pdf(data, Path("luminaire.pdf"))The UGR table and luminance table can be exported as PNG images (17 cm wide, 150 dpi by default) for embedding in Word documents via docxtpl.
import io
from docxtpl import DocxTemplate, InlineImage
from docx.shared import Mm
from eulumdat_report import render_ugr_image, render_luminance_image

# Render from .ldt path (or pass an already-collected ReportData)
ugr_png = render_ugr_image("luminaire.ldt")
lum_png = render_luminance_image("luminaire.ldt")

doc = DocxTemplate("template.docx")
context = {
    "ugr_table": InlineImage(doc, io.BytesIO(ugr_png), width=Mm(170)),
    "lum_table": InlineImage(doc, io.BytesIO(lum_png), width=Mm(170)),
}
doc.render(context)
doc.save("rapport.docx")
Both functions accept width_cm (default 17.0) and dpi (default 150) parameters.
Usage: eulumdat-report [OPTIONS] LDT_FILE

  Generate a photometric datasheet (HTML/PDF) from an EULUMDAT .ldt file.

Options:
  -o, --output-dir DIRECTORY      Output directory  [default: same as LDT_FILE]
  --template FILE                 Custom Jinja2 HTML template
  --html / --no-html              Generate HTML output  [default: html]
  --pdf  / --no-pdf               Generate PDF output   [default: pdf]
  --lum-table / --no-lum-table    Include numerical luminance table  [default: no-lum-table]
  -v, --verbose                   Enable debug logging
  --help                          Show this message and exit
Output filenames are derived from the input basename: luminaire.ldt → luminaire.html / luminaire.pdf.
The default template is src/eulumdat_report/templates/default.html with companion default.css.
To customise, copy both files to a local directory and pass --template to the CLI:
eulumdat-report luminaire.ldt --template my_templates/custom.htmlThe template receives a single data object (ReportData dataclass). The following
Jinja2 filters are available:
| Filter | Description | Example |
|---|---|---|
thousands |
Space-separated thousands (int) | 12334 → 12 334 |
fmt1 |
1 decimal place | 184.6 |
ugr_fmt |
1 decimal or — if None |
18.0 / — |
lum_fmt |
Compact luminance: integer ≤ 99 999, scientific above | 123456 → 1.23e5 |
svg_responsive |
Makes SVG responsive (adds viewBox, sets width=100%) |
SVG fields are embedded inline: {{ data.svg_intensity \| svg_responsive \| safe }}.
data.luminaire_name      # str
data.company             # str
data.luminaire_number    # str
data.isym                # int  (0–4)
data.mc, data.ng         # int  (C-planes, gamma angles)
data.lamp_flux           # float (lm)
data.lamp_watt           # float (W)
data.lorl                # float (%)
data.lum_max             # float | None (cd/m²)
data.svg_intensity       # str | None
data.svg_luminance       # str | None
data.ugr                 # UgrTableData | None
data.lum_table # LuminanceTableData | None| Package | Role |
|---|---|
eulumdat-py |
EULUMDAT parser |
eulumdat-plot |
Polar intensity diagram (SVG) |
eulumdat-luminance |
Polar luminance diagram (SVG) + maximum |
eulumdat-ugr |
UGR catalogue table |
eulumdat-analysis |
Half-angles, FWHM |
jinja2 |
HTML templating |
playwright |
PDF rendering (Chromium headless) |
click |
CLI |
pip install -e ".[dev]"
pytestNew to the ecosystem? eulumdat-quickstart — a step-by-step guide covering all 8 packages with working examples.
| Package | Description |
|---|---|
| eulumdat-py | Read / write EULUMDAT files |
| eulumdat-symmetry | Symmetrise and detect ISYM |
| eulumdat-plot | Polar intensity diagram (SVG/PNG) |
| eulumdat-luminance | Luminance table and polar diagram |
| eulumdat-ugr | UGR catalogue (CIE 117/190) |
| eulumdat-analysis | Beam half-angle, FWHM |
eulumdat-report |
Full photometric datasheet (HTML/PDF) — this package |
| eulumdat-ies | LDT ↔ IES LM-63-2002 conversion |
MIT