Note: This project was originally created by faeldon. This repository includes enhancements with interactive demos, web components, and comprehensive documentation while maintaining all original map data and functionality.
Philippine administrative boundaries in GeoJSON and TopoJSON format at multiple resolutions.
🗺️ View Interactive Demos | 📖 Demo Guide | 🔨 Build Guide | 🚀 Deployment Guide | 📝 Changelog
This repository provides ready-to-use Philippines vector maps for web applications, data visualization, and GIS analysis. Maps are available at all four administrative levels with three resolution options, suitable for use with Leaflet, D3.js, Mapbox GL JS, and other mapping libraries.
- 10,488 map files covering all of the Philippines
- 1,748 administrative units (17 regions, 88 provinces, 1,642 municipalities, 42,048 barangays)
- 3 resolution levels per file (high, medium, low)
- 2 formats (GeoJSON and TopoJSON)
- Interactive demos with resolution selectors and code viewers
- Reusable web component for easy integration
- Comprehensive documentation and build scripts
Map files are organized by year and administrative level:
2023/
├── geojson/                    # GeoJSON format (larger, more compatible)
│   ├── country/                # Level 0: All regions
│   ├── regions/                # Level 1: Provinces per region
│   ├── provdists/              # Level 2: Municipalities per province
│   └── municities/             # Level 3: Barangays per municipality
└── topojson/                   # TopoJSON format (smaller, more efficient)
    └── [same structure]
Each directory contains three resolution subdirectories:
lowres/- 0.1% simplification (smallest, recommended for web)medres/- 1% simplification (balanced)hires/- 10% simplification (most detailed)
Option 1: Direct File Usage
// Fetch a map file
fetch('2023/geojson/country/lowres/country.0.001.json')
  .then(response => response.json())
  .then(data => {
    // Use with Leaflet, D3.js, or other libraries
    L.geoJSON(data).addTo(map);
  });
Option 2: Web Component
<script src="public/components/philippines-map.js"></script>

<philippines-map
    level="1"
    title="Philippine Regions"
    color-scheme="blue"
    height="600px">
</philippines-map>
Option 3: View Demos
Run a local server and explore interactive examples:
python3 -m http.server 8000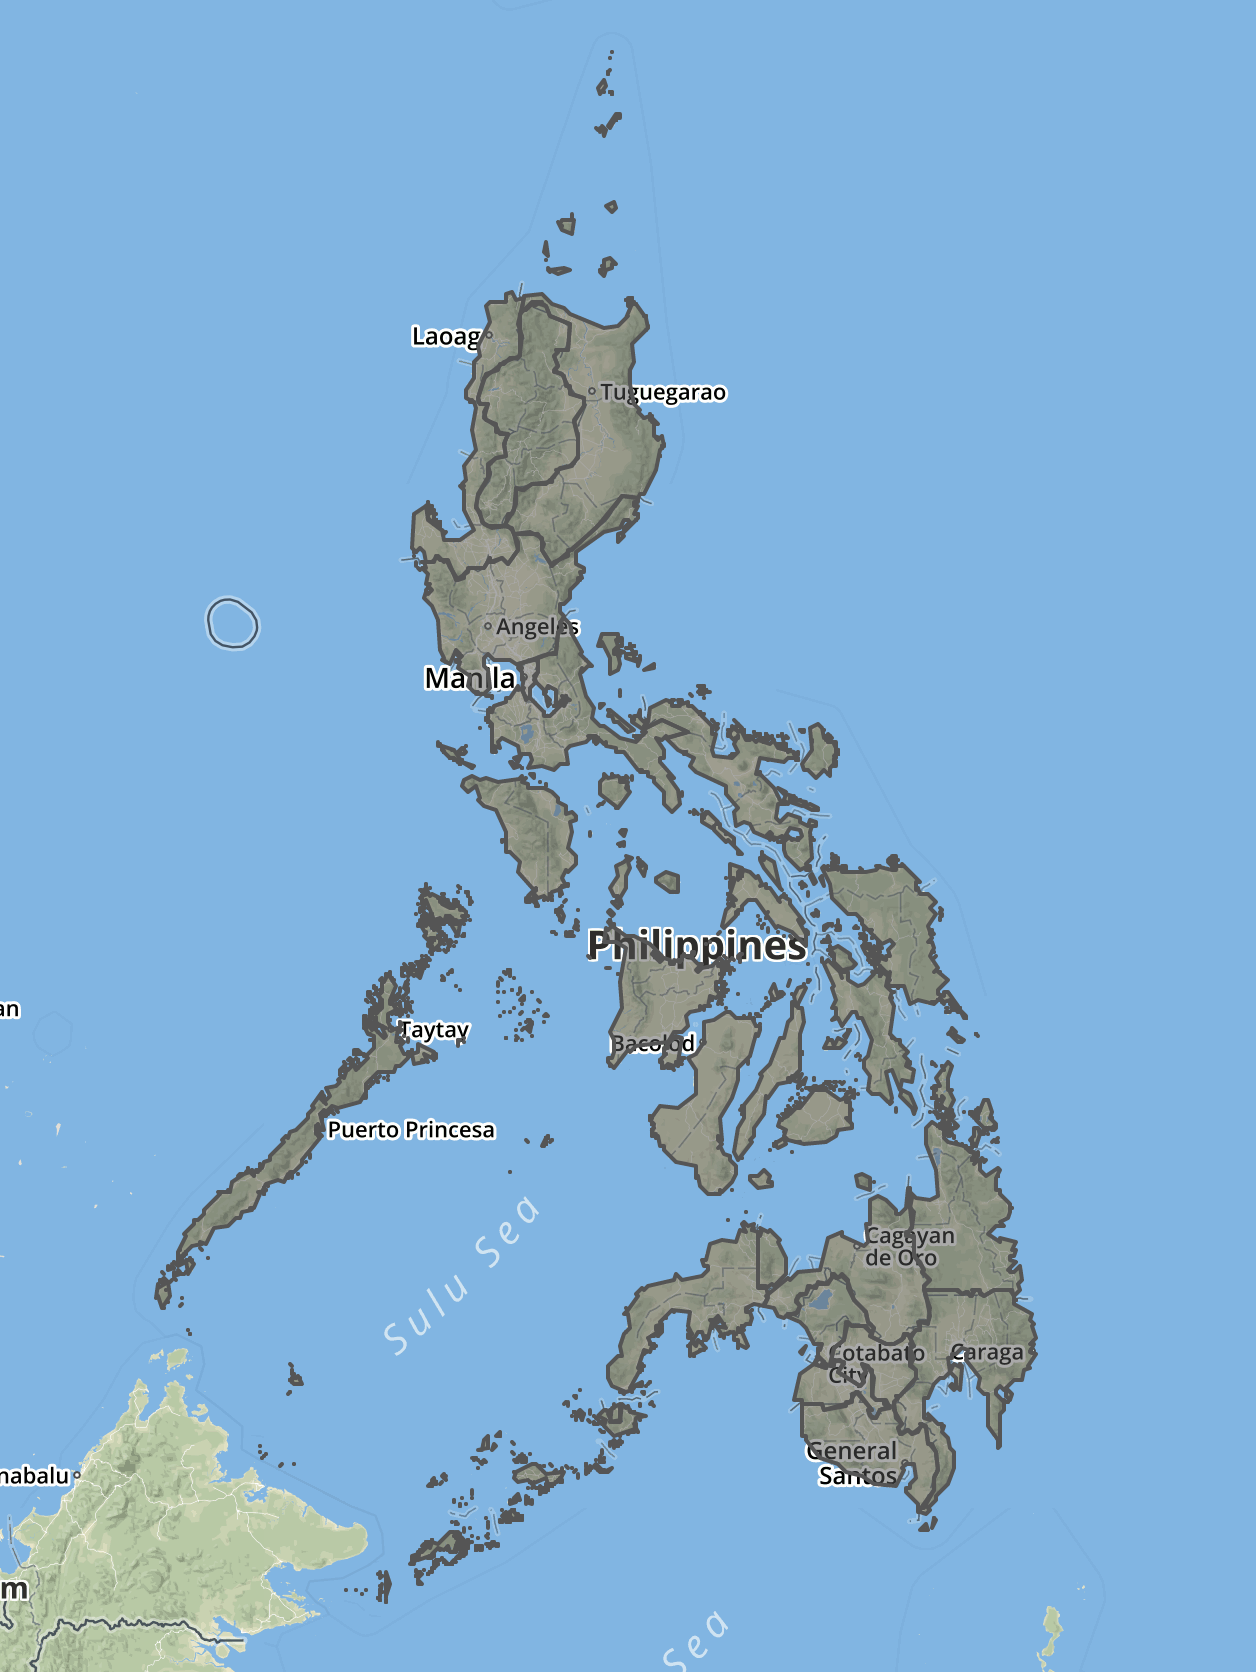
# Open http://localhost:8000/public/demos/Files are generated for all locations in the Philippines at different administrative levels.
For example, the regions map will show regional boundaries on the entire country. Shown below rendered using geojson.io.
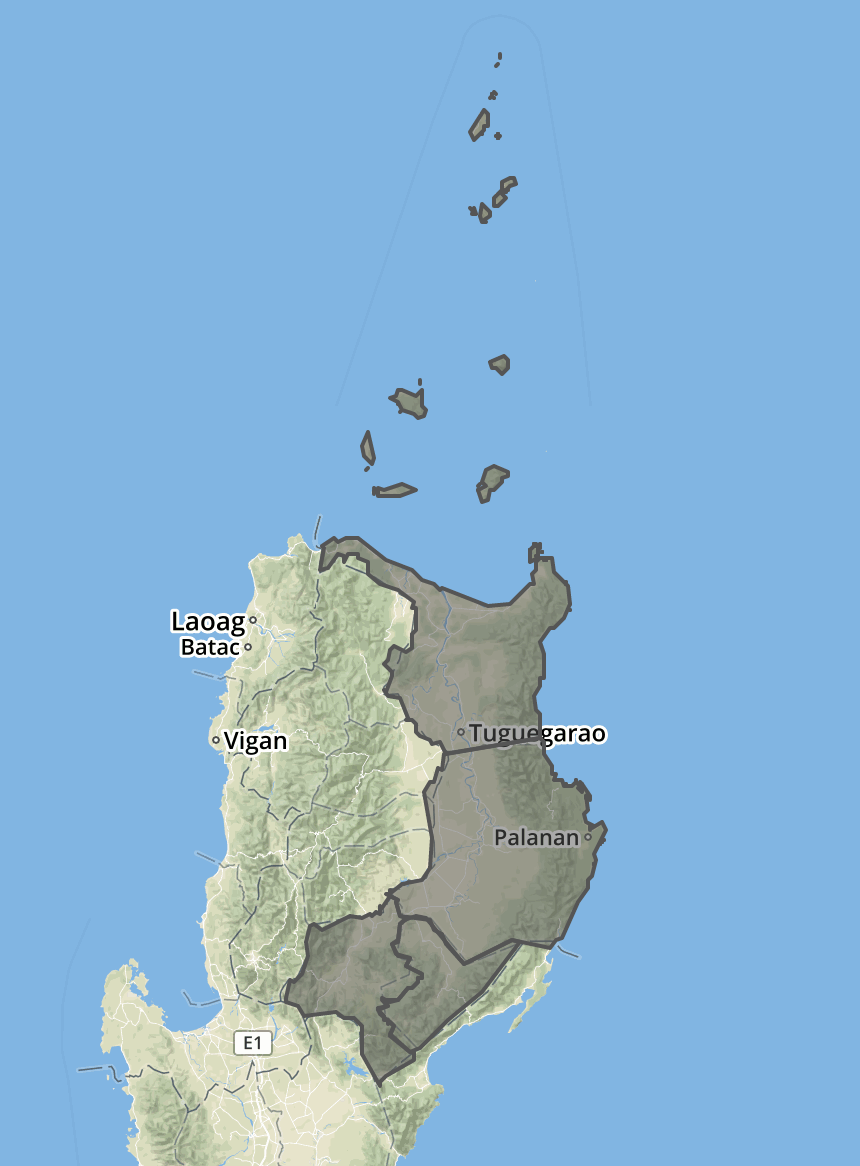
While the each of the provinces map will show provincial boundaries in a region.
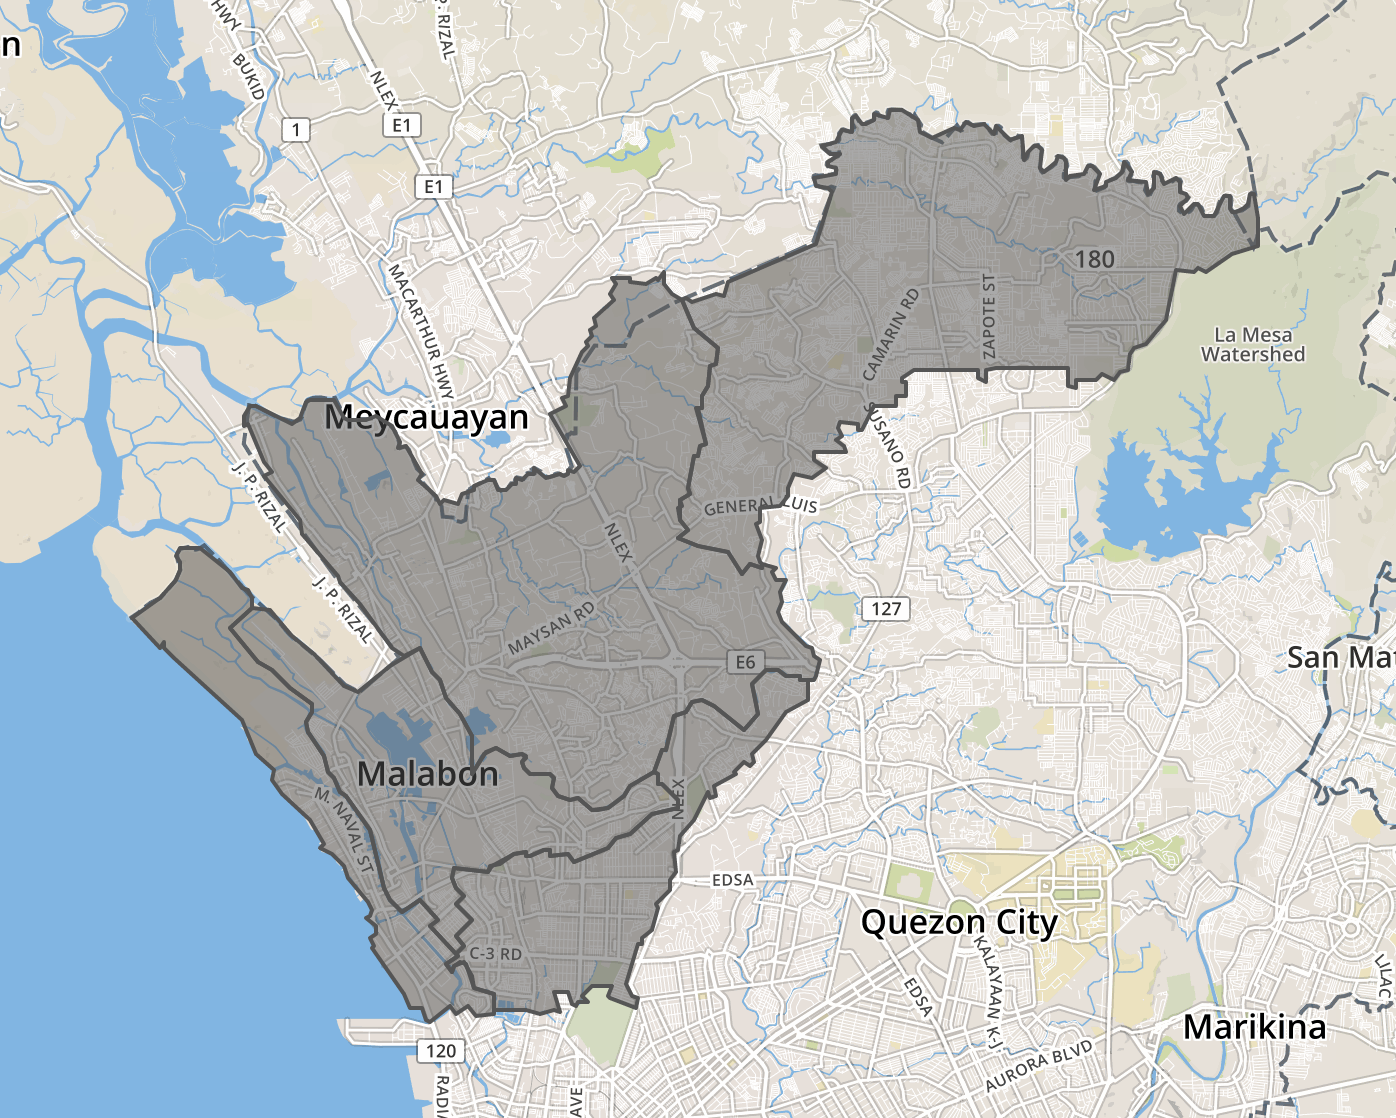
Same with municipalities and cities and barangays.
Fully functional map demos with Leaflet.js and OpenStreetMap tiles are available in public/demos/:
| Demo | Description | Features |
|---|---|---|
| Country | All 17 regions | Resolution selector, hover info, click-to-zoom |
| Regions | All 88 provinces/districts | Resolution selector, province highlighting |
| Provinces | All 1,642 municipalities | Resolution selector, municipality search |
| Municipalities | Barangays by municipality | Dropdown selector for all municipalities |
Demo Features:
- ✅ Resolution Selector: Switch between low/medium/high resolution on-the-fly
- ✅ Show/Hide Code: View source code with syntax highlighting
- ✅ Interactive Controls: Hover, click, zoom, and pan
- ✅ Info Panels: Display administrative unit details
A zero-configuration <philippines-map> web component makes integration effortless:
<script src="public/components/philippines-map.js"></script>

<philippines-map
    level="1"
    title="Philippine Regions"
    color-scheme="blue"
    height="600px">
</philippines-map>
Supported Attributes:
level- Administrative level (0=country, 1=regions, 2=provinces, 3=municipalities)title- Map titlecolor-scheme- Color theme (blue, green, red, purple, orange)height- Map height (default: 500px)show-labels- Display region/province labels (boolean)
Framework Support: Works with vanilla JavaScript, React, Vue, Angular, and other frameworks.
Complete Documentation: See DEMO_GUIDE.md for:
- Managing and replacing demo data
- Converting demos into web components
- Integration with React, Vue, and Angular
- API reference and customization options
Maps are available for all four administrative levels of the Philippines:
| Level | Name | Description | Count | Example Files |
|---|---|---|---|---|
| 0 | Country | All regions nationwide | 1 | country.0.001.json |
| 1 | Regions | Provinces/districts per region | 17 | provdists-region-ph13.0.001.json (NCR) |
| 2 | Provinces | Municipalities per province | 88 | municities-provdist-ph13.0.001.json (Metro Manila) |
| 3 | Municipalities | Barangays per municipality | 1,642 | bgysubmuns-municity-1380300000.0.001.json (Quezon City) |
Total Administrative Units: 1,748 (17 regions + 88 provinces + 1,642 municipalities + 42,048 barangays)
Files follow the pattern: {type}-{parent}-{code}.{resolution}.json
- Country:
country.{0.1|0.01|0.001}.json - Regions:
provdists-region-{REGION_CODE}.{resolution}.json - Provinces:
municities-provdist-{PROVINCE_CODE}.{resolution}.json - Municipalities:
bgysubmuns-municity-{MUNICIPALITY_CODE}.{resolution}.json - TopoJSON: Add
.topobefore resolution (e.g.,country.topo.0.001.json)
For convenience, consolidated files combining all administrative units at a level are available in the 2023/ directory:
| File | Description | Size (Low Res) | Use Case |
|---|---|---|---|
municities-all.0.001.json |
All 1,642 municipalities | 1.8 MB | Country-wide municipality map |
provdists-all.0.001.json |
All 88 provinces | 635 KB | Country-wide province map |
Choose the right resolution for your use case:
| Resolution | Simplification | Suffix | File Size | Best For |
|---|---|---|---|---|
| Low | 0.1% | .0.001 |
Smallest | Web applications, mobile apps |
| Medium | 1% | .0.01 |
Balanced | Desktop apps, detailed web maps |
| High | 10% | .0.1 |
Largest | Print, GIS analysis, high-detail viz |
Recommendation: Use low-resolution TopoJSON files for web applications (60-80% smaller with gzip).
Current Version (2023):
- Source: UN OCHA - Humanitarian Data Exchange
- Dataset: Philippines Administrative Boundaries (PSGC)
- Reference Date: November 6, 2023
- PSGC Version: Q4 2023 (December 31, 2023)
- Projection: EPSG:4326 (WGS84 Lat/Long)
- Original Size: 882 MB (shapefiles)
Alternative Source:
- altcoder/philippines-psgc-shapefiles
- Uses different field naming convention (requires original build scripts)
PSGC Official Documentation:
Previous map versions are available for historical reference:
| Version | Directory | Notes |
|---|---|---|
| 2023 | 2023/ |
Current, uses OCHA data with updated boundaries |
| 2019 | 2019/ |
Legacy, different naming convention |
| 2011 | 2011/ |
Legacy, different naming convention |
Note: 2011 and 2019 versions use barangays/, municities/, provinces/, regions/ directory structure (different from 2023).
The conversion process uses industry-standard geospatial tools:
- Extract: Unzip source shapefiles from UN OCHA dataset
- Filter: Use
ogr2ogrto filter by administrative code (PCODE) - Convert: Transform shapefiles to high-fidelity GeoJSON with WGS84 projection
- Simplify: Use
mapshaperto create three resolution levels (10%, 1%, 0.1%) - Compress: Convert GeoJSON to compact TopoJSON format
- Validate: Set PCODE as ID field for easy data joining
Tools Used:
- ogr2ogr (GDAL 3.11.4) - Shapefile filtering, format conversion, projection transformation
- mapshaper (0.6.113) - Geometry simplification, GeoJSON/TopoJSON generation
Total Build Time: ~23 minutes (barangay level takes longest at 15-20 minutes)
Want to rebuild the maps yourself? We provide a complete step-by-step guide:
📘 BUILD_GUIDE.md - Comprehensive build documentation covering:
- ✅ Prerequisites - Installing GDAL, mapshaper, and required tools
- ✅ Download Source Data - Getting shapefiles from UN OCHA (882 MB)
- ✅ Setup Environment - Preparing your workspace
- ✅ Build Process - Running all 4 build scripts step-by-step
- ✅ Verification - Testing and validating generated files
- ✅ Troubleshooting - Common issues and solutions
- ✅ Advanced Options - Customization and optimization
Quick Start:
# 1. Install tools
brew install gdal
npm install -g mapshaper

# 2. Download source data (see BUILD_GUIDE.md or DOWNLOAD_SOURCE_DATA.md)
# Place phl_shapefiles.zip in repository root

# 3. Run build scripts
cd scripts
./topojson-country.sh                # < 1 minute
./topojson-regions-fixed.sh          # ~2 minutes
./topojson-provdists-fixed.sh        # ~5 minutes
./topojson-municities-fixed.sh       # ~20 minutes

# 4. Verify output
cd ..
find 2023 -name "*.json" | wc -l     # Should show 10,488 files
See Also:
- DOWNLOAD_SOURCE_DATA.md - Detailed instructions for downloading source shapefiles
- CLAUDE.md - Technical documentation for developers
- BUILD_SUMMARY.md - Build statistics and file counts
// Initialize map
const map = L.map('map').setView([12.8797, 121.7740], 6);

// Add OpenStreetMap tiles
L.tileLayer('https://{s}.tile.openstreetmap.org/{z}/{x}/{y}.png', {
    attribution: '© OpenStreetMap contributors'
}).addTo(map);

// Load and display Philippines regions
fetch('2023/geojson/country/lowres/country.0.001.json')
    .then(response => response.json())
    .then(data => {
        L.geoJSON(data, {
            style: { color: '#3388ff', weight: 2, fillOpacity: 0.2 },
            onEachFeature: (feature, layer) => {
                layer.bindPopup(`<strong>${feature.properties.ADM1_EN}</strong>`);
            }
        }).addTo(map);
});// Load TopoJSON file
d3.json('2023/topojson/country/lowres/country.topo.0.001.json')
.then(data => {
const geojson = topojson.feature(data, data.objects.country);
// Create projection
const projection = d3.geoMercator().fitSize([width, height], geojson);
const path = d3.geoPath().projection(projection);
// Draw map
svg.selectAll('path')
.data(geojson.features)
.enter()
.append('path')
.attr('d', path)
.attr('fill', '#3388ff')
.attr('stroke', '#fff');
});import { useEffect, useState } from 'react';
import { MapContainer, TileLayer, GeoJSON } from 'react-leaflet';
function PhilippinesMap() {
const [geoData, setGeoData] = useState(null);
useEffect(() => {
fetch('/2023/geojson/country/lowres/country.0.001.json')
.then(res => res.json())
.then(data => setGeoData(data));
}, []);
return (
<MapContainer center={[12.8797, 121.7740]} zoom={6}>
<TileLayer url="https://{s}.tile.openstreetmap.org/{z}/{x}/{y}.png" />
{geoData && <GeoJSON data={geoData} />}
</MapContainer>
);
}- ✅ Complete Coverage: All 4 administrative levels of the Philippines
- ✅ Multiple Resolutions: High (0.1), Medium (0.01), Low (0.001) for every file
- ✅ Two Formats: GeoJSON (universal) and TopoJSON (compact)
- ✅ PSGC Compliant: Uses official Philippine Standard Geographic Codes
- ✅ Web Optimized: Low-resolution files perfect for web applications
- ✅ Interactive Demos: Ready-to-use examples with Leaflet.js
- ✅ Web Component: Zero-config
<philippines-map>custom element - ✅ Framework Agnostic: Works with React, Vue, Angular, vanilla JS
- ✅ Open Source: MIT licensed, free for commercial and personal use
- ✅ Well Documented: Comprehensive guides and examples
- ✅ Build Scripts: Regenerate maps with custom settings
- ✅ Up to Date: Based on Q4 2023 PSGC data
- BUILD_GUIDE.md - Complete guide to building maps from source shapefiles
- DOWNLOAD_SOURCE_DATA.md - Instructions for downloading source data
- DEMO_GUIDE.md - Interactive demos and web component guide
- DEPLOYMENT_GUIDE.md - Deploy demos to GitHub Pages or web hosting
- BUILD_SUMMARY.md - Build statistics and file counts
- CLAUDE.md - Technical documentation for developers
- CHANGELOG.md - Version history and notable changes
Contributions are welcome! Here's how you can help:
- 🐛 Report Issues: Found incorrect boundaries or data errors? Open an issue
- 💡 Suggest Features: Have ideas for improvements? Share them!
- 🔧 Submit Pull Requests: Fix bugs or add features
- 📖 Improve Documentation: Help make the docs clearer
- ⭐ Star the Repository: Show your support!
Before contributing, please read the Code of Conduct.
If you find incorrect boundaries or outdated information:
- Check the PSGC official data for verification
- Open an issue with:
- Administrative unit name and code
- Description of the error
- Source reference (if available)
- Screenshots (if applicable)
This project is licensed under the MIT License - see the LICENSE file for details.
Attribution: Maps are based on data from:
- UN OCHA - Humanitarian Data Exchange
- Philippine Statistics Authority (PSA) - PSGC
- Philippine Statistics Authority for maintaining the PSGC system
- UN OCHA for providing the humanitarian data exchange platform
- altcoder for the original PSGC shapefiles repository
- All contributors and users of this project
- 📋 Issues: GitHub Issues
- 💬 Discussions: GitHub Discussions
Administrative unit metadata is available in CSV format in the public/metadata/ directory:
| File | Description | Records | Use Case |
|---|---|---|---|
| municipalities.csv | All municipalities/cities | 1,642 | Lookups, dropdowns, data joining |
| provinces.csv | All provinces/districts | 88 | Lookups, navigation, filtering |
Fields Included:
- PCODE (unique identifier)
- Name (English)
- Parent administrative unit codes
- Region/Province associations
Usage Example:
// Load municipality data
fetch('public/metadata/municipalities.csv')
    .then(response => response.text())
    .then(csv => {
        // Parse CSV and use for lookups
        const municipalities = parseCSV(csv);
        populateDropdown(municipalities);
    });
Made with ❤️ for the Philippines
Last Updated: October 16, 2025 | Data Version: PSGC Q4 2023