![]()
A powerful post-processing tool for LC-MS based metabolomics that simplifies peak integration, quality control, and data analysis.
- Targeted Peak Integration - Extract chromatograms and quantify peaks from mzML/mzXML files
- Interactive Visualization - Explore chromatograms, heatmaps, and clustering results
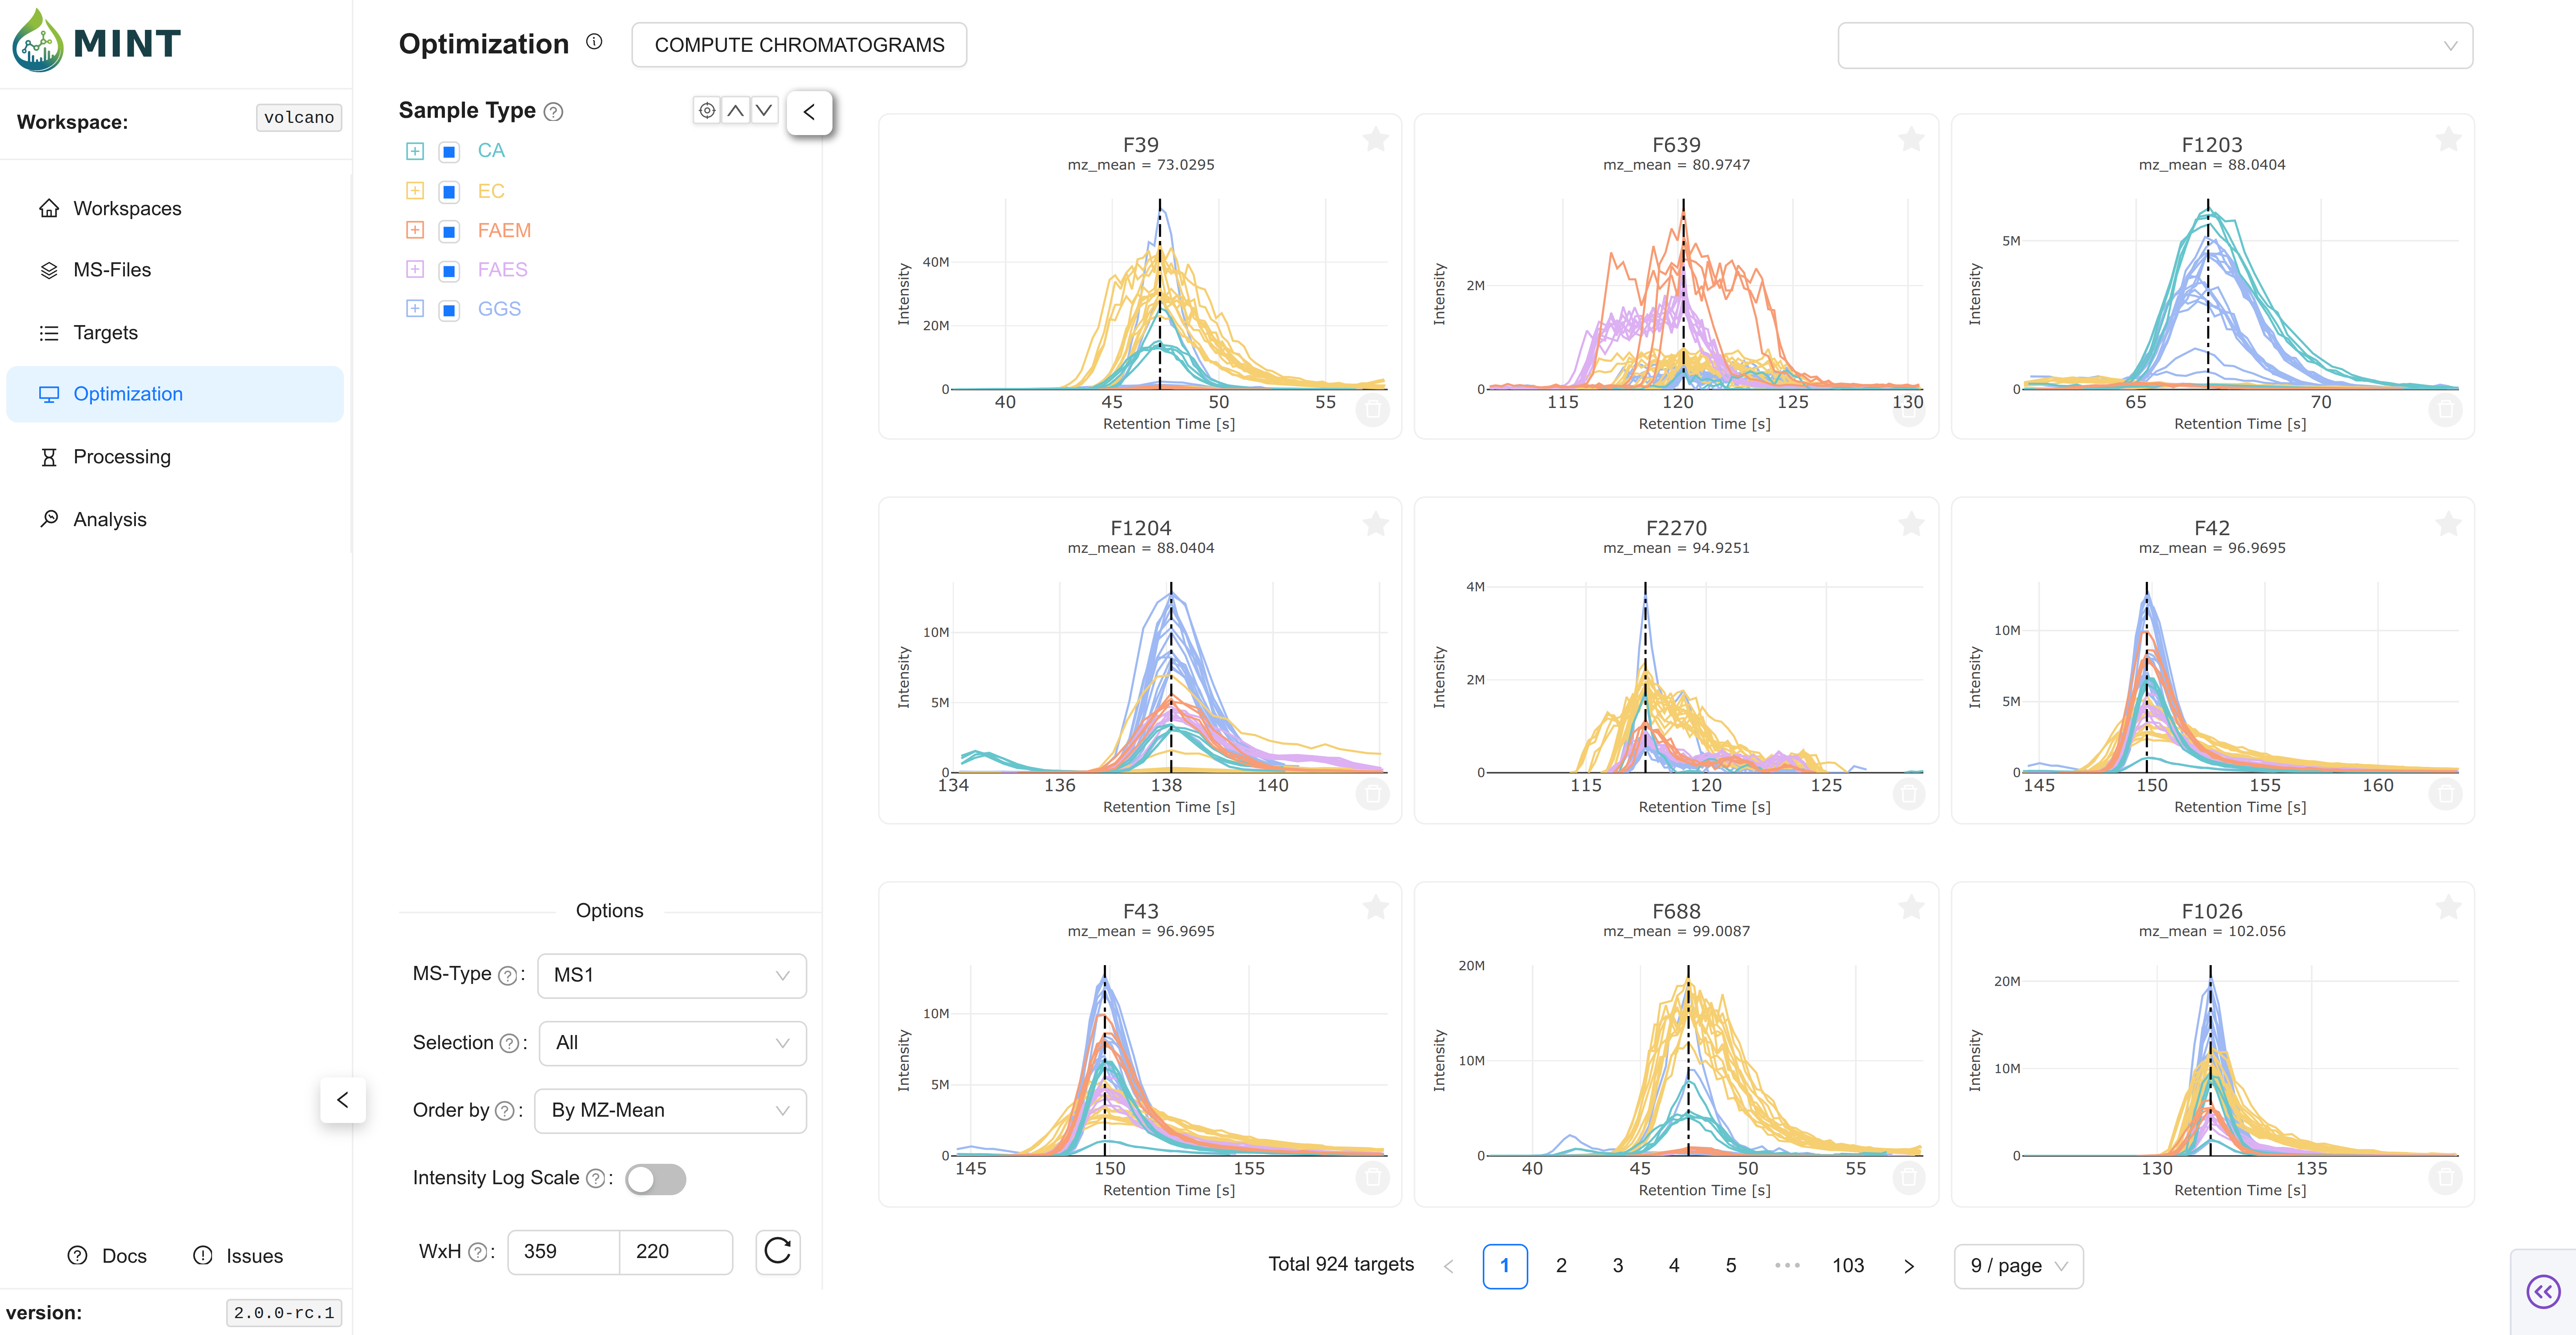
- RT Optimization - Fine-tune retention time windows with visual feedback
- Optional Quantification (SCALiR) - Available in the Processing tab for absolute quantification when needed
- DuckDB Backend - Fast, efficient storage for large datasets
- Desktop App - Available as standalone Windows and Linux executable
# Create conda environment. Requires Python 3.12+
conda create -n ms-mint-app2 python==3.12
conda activate ms-mint-app2

# Install the package from PyPI
pip install ms-mint-app2

# Run MINT
Mint
Builds are provided with all dependencies integrated for Windows and Linux.
For detailed installation instructions, see the Installation Guide.
- Full Documentation - Complete user guide
- Quick Start Tutorial - Get up and running in 5 minutes
-
Brown K, et al. Microbiota alters the metabolome in an age- and sex-dependent manner in mice. Nat Commun. 2023;14: 1348.
-
Ponce LF, et al. SCALiR: A Web Application for Automating Absolute Quantification of Mass Spectrometry-Based Metabolomics Data. Anal Chem. 2024;96: 6566–6574.
All contributions are welcome! This includes:
- Bug reports and fixes
- Documentation improvements
- Feature requests and enhancements
- Code reviews
Please open a GitHub issue to get started.
This project builds on the amazing open-source community:
Special thanks to GitHub,PyPI, and the Plotly Community for their invaluable resources.
This project is licensed under the Apache License 2.0.