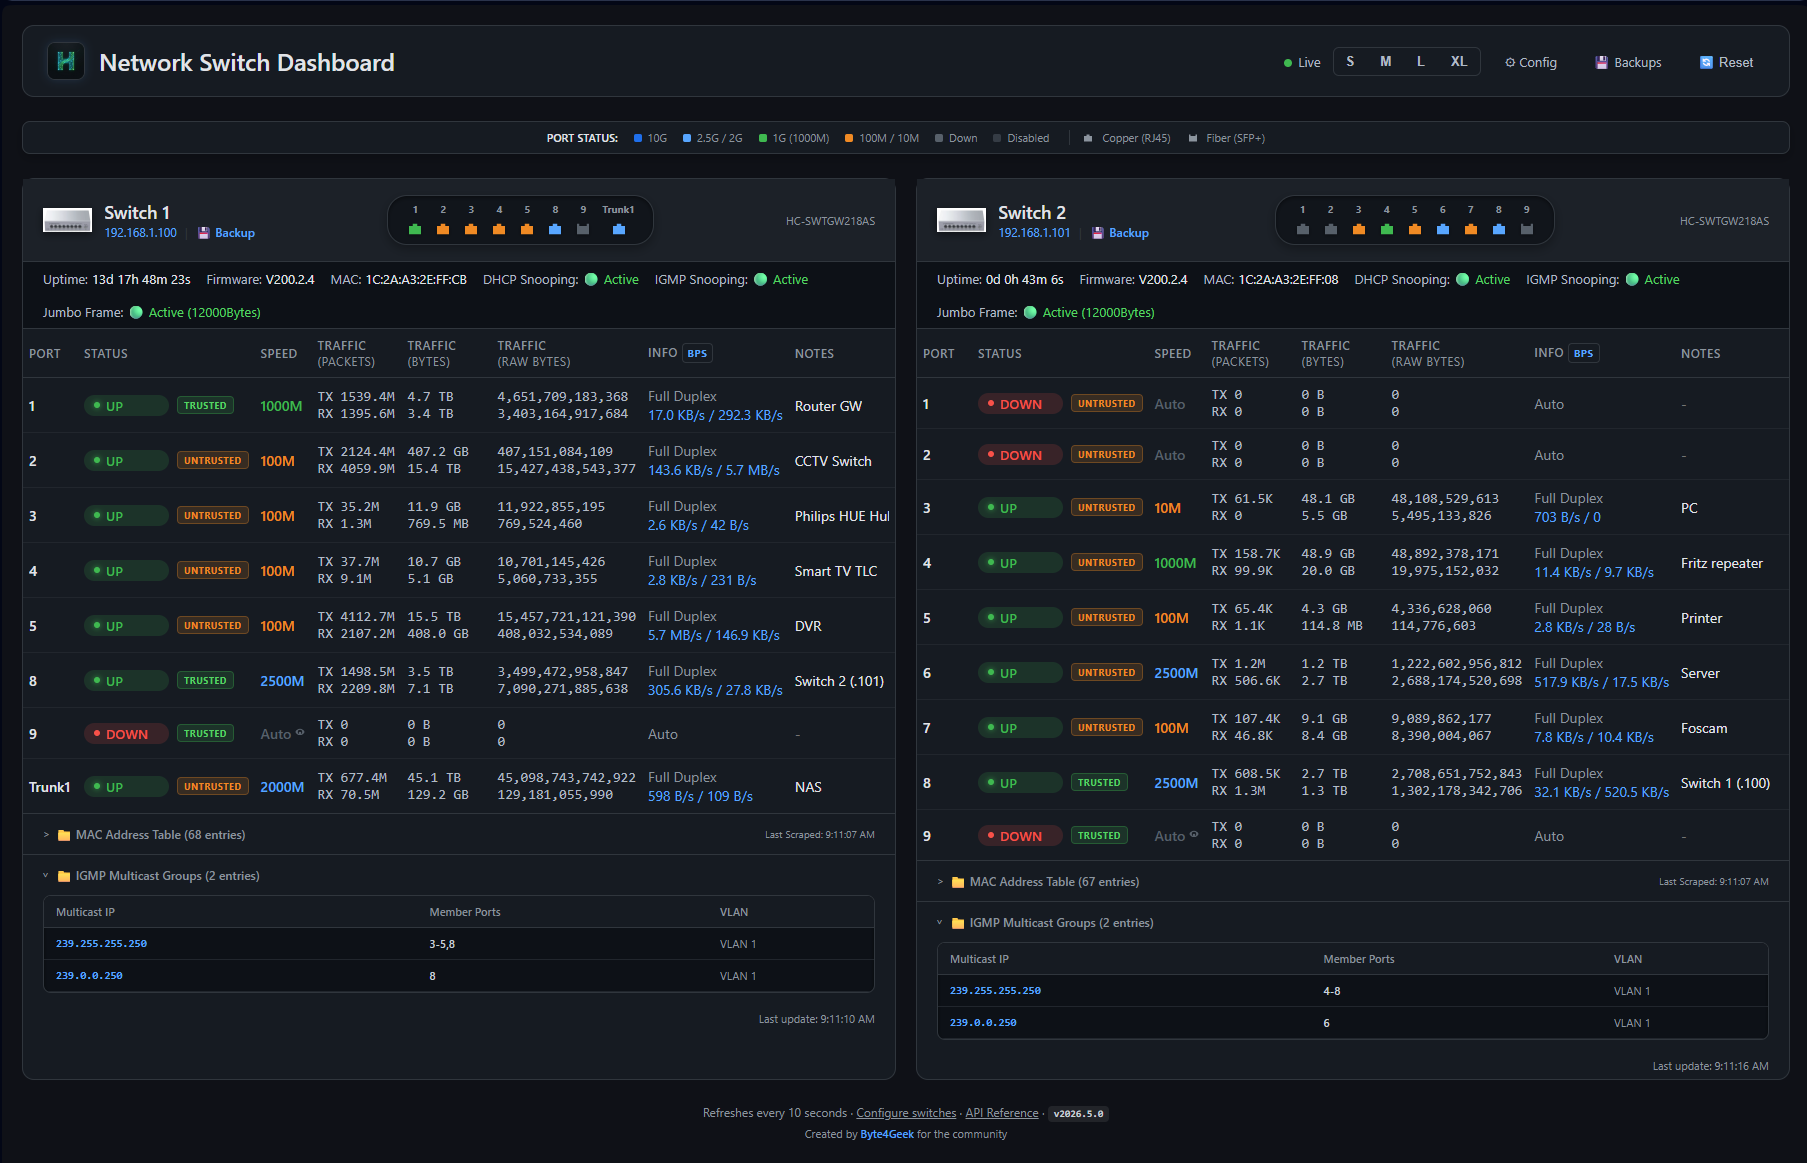
A premium, high-performance, real-time monitoring dashboard designed for Managed Chiese Switches similar to HORACO HC-SWTGW218AS 8-Port + 2-Port SFP+ (10G) managed switches. The dashboard queries the switch’s native HTTP CGI interface, meaning no SNMP setup or configuration is required.
Built with a gorgeous, high-tech glassmorphic dark-mode interface, it features automatic rolling bandwidth history, persistent byte-delta tracking, MAC address table searches, on-demand optical transceiver telemetry (DDMI), and a built-in interactive API explorer.
This dashboarb support these device:
This tool support RTLPlaygroung firmware too.
- Stunning Dark Mode: Custom typography (Outfit/Inter/JetBrains Mono), harmonized color palettes, and frosted-glass components (
backdrop-filter: blur(12px)) that look amazing on operations consoles. - Micro-Animations: Dynamic state transitions, pulse loading indicators, and rotating refresh controls.
- Adaptive Grid Layout: Tailored viewports supporting smooth font scaling (S / M / L / XL) persisted directly to server settings.
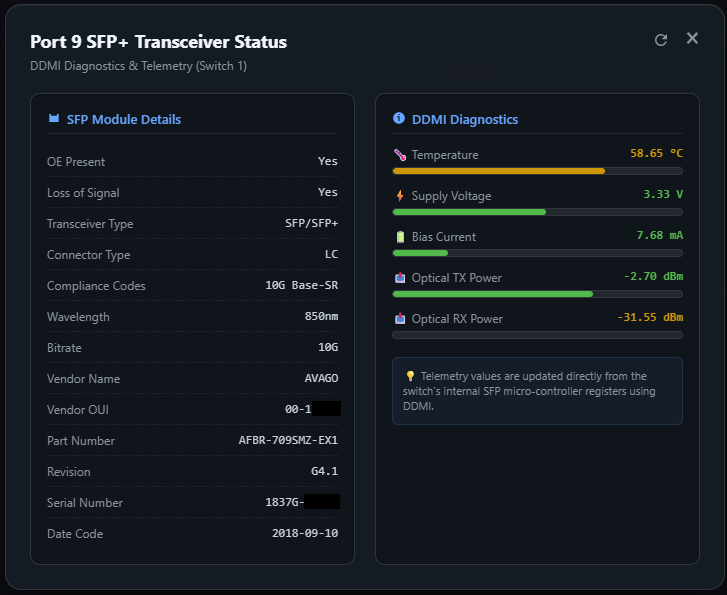
- Real-time Optical Sensors: Click the speed label of an SFP+ port (e.g. Port 9) to display physical module metadata (Vendor, Model, Serial, Compliances, Wavelength) and real-time DDMI diagnostics.
- Visual Telemetry Bars: Progress bars dynamically colored based on safe thresholds for:
- Temperature (°C)
- Supply Voltage (V)
- Bias Current (mA)
- TX/RX Optical Power (dBm)
- Dynamic Refresh Loop: Dedicated refresh button inside the modal to re-scrape physical hardware registers on-demand.
- Bs4 Malformed Parsing Fix: Custom pre-parsing sanitization engine handles malformed switch micro-controller HTML tables (like unclosed
<th>tags closed by</td>), ensuring perfect parsing.
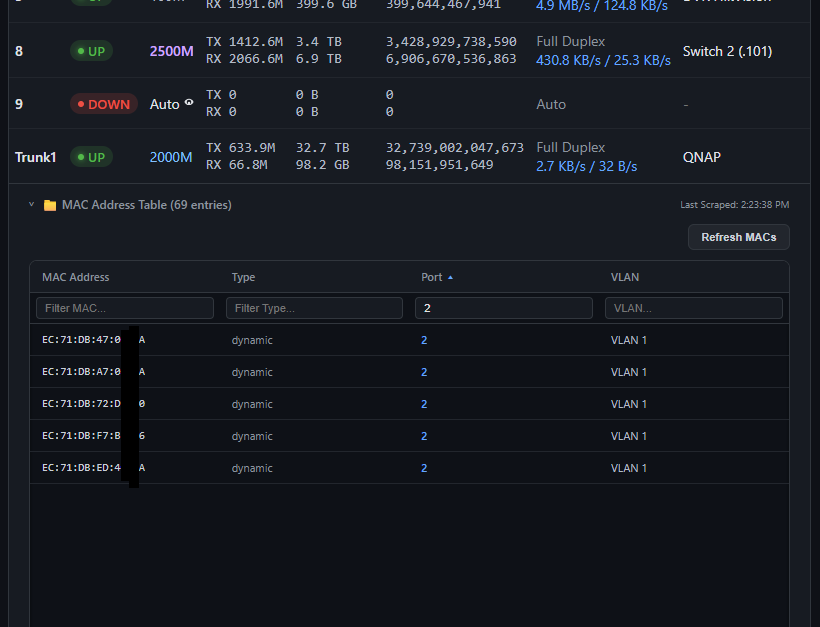
- Multi-Scale Sparklines: Click any standard port speed to launch real-time bandwidth charts powered by Chart.js.
- Three-Tier Historical Ranges:
Live(High-resolution, real-time delta speed in bits per second)1-Hour(Rolling 1-hour average in Bytes per second)24-Hour(Rolling 24-hour average in 15-minute windows)
- Flexible Search & Filtering: Multi-column text filtering makes searching by VLAN, Port, MAC, or status trivial.
- Interactive Height Controls: Dynamically drag to resize table heights (saves user preference to
settings.jsonon disk). - Manual Re-indexing: On-demand POST request scraper forces active switches to dump fresh bridge routing entries.
- Multi-Switch Panel: Dynamically add, modify, or delete switches through a beautifully organized
/configroute. - Persistent Accumulation: Standard bytes counters are persistent across server reboots, complete with a delta tracking script to auto-detect and compensate for switch physical reboots without corrupting traffic metrics.
- Annotation Layer: Add custom, persistent labels/notes (e.g., "Uplink to NAS", "SmartTV") to any port.
- Built-in Docs: Hosted locally at
/api-docswith a beautiful, fast sidebar navigation. - Developer Resources: Contains interactive code cards, response payload previews, parameter grids, and copy-to-clipboard buttons for instant cURL examples.
- Global Configuration Tracking: Scrapes global enable state for DHCP Snooping and IGMP Snooping, rendering status badges directly on the dashboard.
- Port-Level Trust Badges: Real-time port trust classifications are fetched from
/port.cgito show customized untrusted and trusted labels. - IGMP Multicast Tables: Fully parsed multicast group database extracted from
/igmp.cgi?page=dumpdisplayed in an expandable glassmorphic table.
- Frame Size Scraper: Inspects
/fwd.cgi?page=jumboframeto retrieve Jumbo Frame configuration status and parse the exact selected frame size (e.g.9216Bytes).
- Config Backups: Safely triggers configuration archive downloads via
/config_back.cgi?cmd=conf_backup, storing them directly on the server's disk space. - Interactive Manager: Beautiful
/backupsinterface listing saved configs with quick downloads and single-click deletions protected by glassmorphic modal dialogues.
- Remote Power Cycle: Triggers a remote switch reboot via
/reboot.cgisecurely. - Safety Confirmation: Uses an immersive custom warning card modal using frosted glass backdrop effects, with real-time feedback loops during reboot execution.
- Cubic Bezier Routing: Interactive network map displaying real-time physical topology with cubic Bezier curved cables. Source and target port badges track the lines dynamically as you drag nodes.
- Smart Device Grouping: Automatically structures the layout using a levels-based tree schema: Router/Gateway -> Core Managed Switches -> Unmanaged/Virtual Switches -> Repeaters/APs -> Client Devices.
- Persistent Layout Storage: Drag-and-drop to position your network devices exactly where you want them. Coordinates are saved directly to
config.jsonon the server.
The dashboard automatically parses the learned MAC forwarding tables to construct a complete, visual topology map of your network (accessible at /map). By combining managed switch configurations with custom infrastructure devices, you can group and segment devices:

- What it does: Represents the main internet gateway or firewall. It serves as the root node of the layout.
- How to configure: Navigate to
/configand under Infrastructure Devices, click + Add Infrastructure Device. Set the type to Router/Gateway and enter its MAC address. - Layout result: The router will be drawn at the very top level, with uplinks radiating down to the managed core switches.
- What it does: Represents WiFi access points or range extenders that have wireless clients associated with them.
- How to configure: Under Infrastructure Devices, click + Add Infrastructure Device. Set the type to Repeater/AP and enter its MAC address.
- Layout result: Any client device whose MAC address is learned on the same managed switch port as the Repeater will automatically branch under the Repeater node instead of being linked directly to the switch port. This correctly represents wireless clients grouped under their AP.
- What it does: Represents a physical unmanaged switch (or a dummy switch) connected to a specific managed switch port. All devices connected to this unmanaged switch will be grouped under it.
- How to configure: Under Unmanaged Switches, click + Add Unmanaged Switch. Specify:
- Name: The display name for the unmanaged switch (e.g. "Desk Switch").
- Parent Switch: Select the managed parent switch from the dropdown.
- Parent Port: Specify the port number where the unmanaged switch is connected.
- Layout result: All clients and infrastructure devices (like repeaters) learned on that managed parent port will automatically link to the unmanaged switch node. The unmanaged switch is then uplinked to the parent managed switch port.
- What it does: Stops querying a specific switch (reducing CGI page polling load) and completely hides it and its downstream devices from view.
- How to configure: In the Switches section, toggle the Enabled slider checkbox to off.
- Layout result: The switch disappears from both the main dashboard and the network map. Any offline client devices whose last known location was this disabled switch are automatically filtered out to prevent orphan floating nodes.
The Switch Dashboard supports monitoring virtual networking via Open vSwitch (OVS) running on a Proxmox VE host. This allows you to view LXC containers and VM interfaces connected to your virtual bridges directly in your network map and tables.
Follow the steps below to install OVS on your Proxmox host, configure the virtual bridge, set up a dedicated monitoring user with restricted sudo permissions, and integrate it into the dashboard.
Log in to your Proxmox VE host via SSH as root (or a user with sudo privileges) and run:
sudo apt update && sudo apt install openvswitch-switch -yTo migrate from a standard Linux bridge to an OVS bridge:
- Access the Proxmox Web GUI (
https://<your-proxmox-ip>:8006). - Go to Datacenter -> [Your Node] -> System -> Network.
- Select the default Linux bridge (usually
vmbr0) and click Remove. (Note: This staging action will not disconnect you immediately). - Click Create -> Select OVS Bridge.
- Configure the new OVS Bridge:
- Name:
vmbr0 - IPv4/CIDR:
192.168.1.15/24(use the IP address of your Proxmox host) - Gateway (IPv4):
192.168.1.1(your network gateway) - Bridge Ports:
enp3s0(your physical network interface name)
- Name:
- Click Apply Configuration to commit the staged changes. The network configuration will reload instantly, switching the backend to Open vSwitch without restarting the host.
The Switch Dashboard retrieves statistics securely over SSH. Instead of using the root account, create a dedicated system user:
- Add the user
ovs-monitoron the Proxmox host:Follow the prompts to configure a strong password.sudo adduser ovs-monitor
- Grant the user restricted passwordless sudo privileges. Edit the sudoers configuration:
Append the following line at the end of the file:
sudo visudo
(Ensure these paths match the locations of the commands on your Proxmox host. You can verify them withovs-monitor ALL=(ALL) NOPASSWD: /usr/bin/ovs-vsctl, /usr/bin/ovs-ofctl, /usr/bin/ovs-appctl, /usr/sbin/pct, /usr/sbin/qmwhich ovs-vsctl pct qm)
You can add the OVS switch from the dashboard's /config web interface or directly in config.json by adding a switch object with "model": "openvswitch" or "model": "ovs":
{
  "name": "Proxmox OVS",
  "ip": "192.168.1.15",
  "username": "ovs-monitor",
  "password": "your-password-here",
  "model": "openvswitch",
  "bridge": "vmbr0",
  "port_count": 24
}graph TD
A["User Browser"] -- "HTML5 / JS / Chart.js" --> B["Flask Server: Port 8080"]
B -- "Config / API Route" --> C["Local Cache: config.json / counters.json"]
B -- "Background Poller / Thread" --> D["scraper.py"]
D -- "HTTP POST Login / CGI Scrape" --> E["Managed Switch: 192.168.1.100"]
E -- "/info.cgi, /port.cgi, /transceiver.cgi" --> D
B -- "Interactive Explorer" --> F["API Reference: /api-docs"]
- Backend: Flask (Python 3.9+), single-worker polling thread to prevent session thrashing.
- Frontend: Vanilla ES6 JS, Custom CSS (Aesthetic glassmorphism), Chart.js (multi-tier canvas).
- Scraper: Custom HTTP CookieJar scraper communicating with switch
/login.cgi,/info.cgi,/port.cgi?page=stats, and/transceiver.cgi.
- Python 3.9+
- Operating System: Linux with
systemd(Debian, Ubuntu, CentOS, Arch) or standalone Windows/macOS. - Network Access: Port 80 access to target managed switches (e.g. HORACO
HC-SWTGW218ASor OEM equivalents).
Our automated script handles the entire installation seamlessly, creating a dedicated Python virtual environment to avoid interfering with system packages.
# Clone the repository
git clone https://github.com/byte4geek/switch-dashboard.git
cd switch-dashboard

# Run the installer as root
sudo bash install.sh
The script will:
- Copy all project files to
/opt/switch-dashboard/. - Check for system-level dependencies (
python3-pip,python3-venv). - Set up a secure virtual environment inside
/opt/switch-dashboard/venv. - Install all requirements (
Flask,BeautifulSoup4). - Generate and register a
switch-dashboard.servicewithsystemd. - Start and enable the service on boot.
Once completed, the dashboard is live at:
- Dashboard:
http://<your-ip>:8080 - API Documentation:
http://<your-ip>:8080/api-docs
You can deploy the Switch Dashboard as a lightweight Docker container. All persistent configurations, history files, and switch backups are managed inside a single volume or host directory mapping.
The dashboard keeps its state in several files and a backup folder:
- Configurations & Settings:
config.json,settings.json,notes.json - Bandwidth & Counters:
counters.json,history_hourly.json,history_daily.json - Switch Backups:
/backup/subdirectory
All of the above items are unified under the path specified by the DASHBOARD_DATA_DIR environment variable (defaults to /data in the container). You only need to mount/persist this single folder!
A pre-configured docker-compose.yml is provided in the repository.
-
Clone the repository:
git clone https://github.com/byte4geek/switch-dashboard.git cd switch-dashboard -
Configure your switches: You can either edit
config.jsonbefore running the container, or simply let the container initialize the defaultconfig.jsoninside the mounted volume directory (./data), and then edit it there or via the dashboard's/configpage. -
Start the container:
docker compose up -d
-
Access the dashboard: Go to
http://<your-ip>:8080in your web browser. All your configs, notes, backups, and charts history will be persisted in the local./datafolder on the host.
To run the container manually with the Docker CLI:
-
Build the image:
docker build -t switch-dashboard . -
Run the container with a volume:
docker run -d \
  --name switch-dashboard \
  --restart unless-stopped \
  -p 8080:8080 \
  -v /absolute/path/to/your/data:/data \
  -e DASHBOARD_DATA_DIR=/data \
  switch-dashboard
Replace
/absolute/path/to/your/datawith the actual directory path on your host where you want to store your persistent data.
The dashboard supports template-driven scraping. This enables users to add support for any managed switch model simply by writing a declarative YAML blueprint and placing it in the ./device-templates/ directory.
A switch template is named <model_name>.yaml (where <model_name> matches the model field configured for the switch in /config or config.json).
Here is a complete reference of the YAML blueprint schema:
model: "HC-SWTGW218AS"          # The exact switch model name
manufacturer: "Horaco"           # Brand/Manufacturer name

# 1. Device Global Information (from /info.cgi key-value tables)
device_info:
  url: "/info.cgi"
  method: "key_value_grid"
  mappings:
    uptime: "Sys Uptime"
    mac: "MAC Address"
    ip: "IP Address"
    firmware: "Firmware Version"
    model: "Device Model"

# 2. Port Link Settings & Statuses
ports:
  url: "/info.cgi"
  source: "info_table"           # "info_table" (Horaco style) or "port_table" (KeepLink style)
  columns:
    port: 0
    link: 1
    duplex: 2
    speed: 3
    flow_control: 4

# 3. Port Transmission/Reception counters
statistics:
  url: "/port.cgi?page=stats"
  method: "header_aware"
  terms:
    tx_packets: ["txgoodpkt", "txpackets", "tx packet", "txok"]
    rx_packets: ["rxgoodpkt", "rxpackets", "rx packet", "rxok"]
    tx_bytes: ["txbytes", "tx_bytes", "txgoodbytes"]
    rx_bytes: ["rxbytes", "rx_bytes", "rxgoodbytes"]

# 4. DHCP Snooping Status & Trusted Ports
dhcp_snooping:
  url: "/dhcp_snooping.cgi?page=dump"
  enable_input_name: "enable_dhcpsnp"
  ports_form_action: "page=static"
  trust_checkbox_class: "chkp"

# 5. IGMP Snooping Multicast Groups Table
igmp:
  url: "/igmp.cgi?page=dump"
  enable_input_name: "enable_igmp"
  table_header_keywords: ["IP Address", "Port", "VLAN ID"]

# 6. Jumbo Frame Parameter
jumbo_frame:
  url: "/fwd.cgi?page=jumboframe"
  enable_input_name: "enable_jumbo"
  select_name: "jumboframe"

# 7. MAC Address Forwarding Table (with paging)
mac_table:
  url: "/mac.cgi?page=fwd_tbl"
  page_parameter: "pageidx"
  perpage_parameter: "perpage"
  perpage_value: "3"
  cmd_parameter: "cmd"
  cmd_value: "goto"

# 8. CGI Configuration Backup download
backup:
  url: "/config_back.cgi?cmd=conf_backup"
  referer_path: "/config_back.cgi"
  method: "GET"

# 9. Switch Remote Reboot action
reboot:
  url: "/reboot.cgi"
  referer_path: "/reboot.cgi"
  method: "POST"
  post_data:
cmd: "reboot"To add a dedicated device photo or graphic to the switch card:
- Place a
.png,.jpg, or.jpegfile in the./device-templates/directory. - Name the file exactly after the switch model (e.g.
HC-SWTGW218AS.png). - If no custom image is found, the system will seamlessly fall back to a beautifully stylized 8-port switch icon located at
/static/switch_icon.png.
If you prefer to configure the dashboard manually or want to run it on non-systemd machines (Windows / macOS):
python3 -m venv venv
source venv/bin/activate
pip install -r requirements.txtCreate or edit /opt/switch-dashboard/config.json:
{
  "title": "Network Command Center",
  "refresh_interval": 10,
  "mac_refresh_multiplier": 5,
  "switches": [
    {
      "name": "HORACO Core",
      "ip": "192.168.1.100",
      "username": "admin",
      "password": "admin",
      "model": "HC-SWTGW218AS",
      "port_count": 9
    }
  ]
}python3 app.pyThe dashboard includes a set of REST endpoints. For complete details, response payloads, and copyable cURL examples, navigate to the /api-docs route.
| Method | Endpoint | Description |
|---|---|---|
GET |
/api/switches |
Returns live status of all switches and ports, including custom notes. |
GET |
/api/switches/<ip>/transceiver |
Returns parsed SFP module diagnostics and DDMI telemetry. |
POST |
/api/switches/<ip>/refresh_mac |
Forces an immediate scrape and returns the active MAC forwarding table. |
GET |
/api/speeds |
Returns real-time delta speed states (Bytes/s, bps) for active interfaces. |
GET |
/api/history |
Returns high-res historical statistics for Chart.js (live, 1h, 24h). |
POST |
/api/notes |
Attaches a persistent label/description to a port (saves to notes.json). |
GET |
/api/settings |
Retrieves global UI preferences (e.g., base font scale). |
POST |
/api/settings |
Updates global UI settings on the disk. |
POST |
/api/reset |
Purges cumulative logs and bandwidth cache, resetting delta Baselines. |
POST |
/api/switches/<ip>/backup |
Triggers a configuration backup and saves the binary archive to the server's disk. |
POST |
/api/switches/<ip>/reboot |
Safely sends a reboot trigger to the physical switch hardware. |
GET |
/api/backups |
Lists all configuration backups stored on the server. |
GET |
/api/backups/<filename>/download |
Downloads a specific saved switch configuration file. |
DELETE |
/api/backups/<filename> |
Deletes a specific switch configuration file from the server. |
GET |
/backups |
Returns the HTML template for the backups manager dashboard. |
GET/POST |
/api/vendors |
Retrieves or saves custom MAC vendor mappings (mac_vendors.txt). |
POST |
/api/vendors/update_oui |
Manually downloads and caches the official IEEE OUI and OUI-36 databases. |
/opt/switch-dashboard/
├── app.py              # Flask core service, poller thread, and REST API routes
├── scraper.py          # Switch scraping engine, custom login cookie session, and tags cleaner
├── config.json         # User-defined switches, polling intervals, and general configuration
├── counters.json       # Persistent cumulative traffic database
├── notes.json          # Persistent custom port descriptions
├── settings.json       # Persisted user UI configurations (e.g. font sizes, table dimensions)
├── mac_vendors.txt     # Local custom OUI vendor names/overrides file
├── oui.txt             # Downloaded official IEEE OUI-24 database
├── oui36.txt           # Downloaded official IEEE OUI-36 database
├── install.sh          # Self-healing, multi-distro Linux automated systemd installer
├── requirements.txt    # Python package dependencies
├── templates/
│   ├── index.html      # Main high-tech glassmorphic dashboard
│   ├── config.html     # Switch configurator interface
│   └── api_docs.html   # Premium built-in developer documentation manual
└── static/
    ├── style.css       # Premium core CSS tokens, custom dark scrollbars, and layouts
    ├── app.js          # Core front-end logic, rendering engine, Chart.js mapping
    └── logo.png        # Horaco brand assets
This project is licensed under the MIT License. Feel free to modify, distribute, or incorporate it into your network setup.
- ⠿ Draggable Nodes sequence:
- Implemented HTML5 drag-and-drop node reordering in the configuration settings page (
/config), with a custom grab indicator handle⠿. - Dynamically recalculates and updates all internal DOM indices, hidden enable fields, checkbox toggles, and callbacks on drop to ensure form inputs stay synchronized.
- Form submission saves switches to
config.jsonin the new DOM order, and the main page/renders switch panels in the exact sequence configured.
- Implemented HTML5 drag-and-drop node reordering in the configuration settings page (
- 🔌 Unified Port Speed Formats:
- Unified the representation of port speeds across all switch types (Open vSwitch, Fritz!Box, and Managed Switches).
- Automatically translates raw bit speeds (like
2500M,1000M) to unified speed labels (like2.5G,1G), aligning with standard virtual and router node speed conventions.
- ⏱️ Configurable Request Retries & HTTP 404 Optimization:
- Added a new
Max Request Retriesparameter in/config(General Settings) to customize switch query retries (set to 0 to disable retries). - Optimized the internal scraper retry engine to fail fast and abort retries immediately when encountering
HTTP 404 Not Founderrors, preventing thread blocking, scraping lag, and missing throughput charts.
- Added a new
- 🕸️ Interactive Network Topology Map:
- Implemented custom Bezier curve routing equations to position port badges precisely along cables during node drags.
- Added layout reset confirmation dialogs in English to prevent accidental map layout clears.
- Auto-expanded node card width calculations based on client names and sublabels.
- 🔌 Unmanaged Switches / Virtual Switches Support:
- Added support for defining unmanaged switches connected to specific ports of managed switches.
- Automatically structures downstream devices (clients and repeaters) under the unmanaged switch node, enabling accurate client grouping.
- 🎛️ Configured Switch Deactivation:
- Added a switch deactivation toggle checkbox on the configuration page with a clean slider toggle styling.
- Skips background scraping threads for disabled switches, purges their cached data, and hides them from the main index and network map.
- Filters out orphan offline client devices whose last known parent switch is disabled to prevent scattering layout errors.
- 🌐 Dynamic MAC Address Vendor Resolution:
- Automatically matches MAC addresses to manufacturers using the official IEEE OUI registry (
oui.txtandoui36.txt). - Added support for a custom MAC vendors file (
mac_vendors.txt) mapping local MAC prefixes to custom device names (e.g.,AA:BB:CC Custom Local Device). - Included a Custom MAC Vendors Editor directly on the Settings configuration page.
- Implemented an IEEE OUI Database Update utility card in
/configto manually download the latest registration lists. - Added query rate warnings detailing IEEE's query limits (maximum 1 download request per day to prevent IP address bans).
- Automatically matches MAC addresses to manufacturers using the official IEEE OUI registry (
- 🎛️ Interactive Table Resizing & Reordering:
- Implemented interactive drag-and-drop reordering for all dashboard switch table columns.
- Added support for interactive column width resizing by dragging column margins.
- Persists custom widths and column ordering directly inside local browser cookies.
- Implemented cell auto-wrapping when columns are resized narrow, preventing text overflow.
- 🎨 General Layout Config & Column Visibility:
- Added a General Settings layout option dropdown in
/configto choose the maximum number of switches shown side-by-side (Auto, 1, 2, 3, or 4). - Added a column visibility checklist in the Settings page to enable or disable individual dashboard columns dynamically.
- Added a General Settings layout option dropdown in
- 📖 API Docs Update:
- Documented
POST /api/vendors/update_ouiandGET/POST /api/vendorsendpoints in the local/api-docspath.
- Documented
- 🔌 RTLPlayground Custom Switch Firmware Support:
- Generated and packaged a dedicated declarative switch scraper template
RTLPlayground.yamlto fully support Realtek RTL8372/RTL8373 switches running the open-source RTLPlayground alternative firmware bylogicog. - Added support for the default RTLPlayground network segments (e.g.
192.168.10.247), uIP embedded web server structures, and specialized/ports,/stats,/vlan,/config, and/rebootAPI pathways. - Automatically parses port status states, EEE configurations, packet transmission statistics, and handles safe device reboots.
- Generated and packaged a dedicated declarative switch scraper template
- 📋 Dynamic YAML-Driven Scraper Blueprints:
- Implemented dynamic, extensible scraping logic driven by declarative YAML templates under
./device-templates/. - Seamlessly appended CGI settings for administrative actions: Configuration Backup downloads (
backup) and Switch hardware reboots (reboot) inside reference blueprints. - Custom switch models now support 100% template-driven telemetry retrieval (Device Info, Port Link speed, Packets/Bytes statistics, DHCP trust, IGMP multicast, and MAC tables).
- Implemented dynamic, extensible scraping logic driven by declarative YAML templates under
- 🎨 Custom Switch Graphic Icons:
- Automatically loads per-model graphics (e.g.
./device-templates/HC-SWTGW218AS.pngor.jpg) in the dashboard switch card, falling back to a newly designed premium stylized 8-port switch icon at/static/switch_icon.pngif missing.
- Automatically loads per-model graphics (e.g.
- 📂 Bounded Rotational Logging Directory:
- Relocated and consolidated logging output to the dedicated
./logs/directory (logs/dashboard.log), securely ignoring all log traces inside.gitignore.
- Relocated and consolidated logging output to the dedicated
- 🩹 Dynamic Switch Model Fallback:
- Fixed a bug where switches that do not explicitly report their model inside
/info.cgi(such asLIANGUO LG-SG5T1) incorrectly fell back to a hardcoded"HC-SWTGW218AS"model name in the UI. The scraper now dynamically falls back to the exact model name specified inconfig.json. - Changed the default fallback in
scraper.py(when the"model"attribute is omitted fromconfig.jsonentirely) to a clean, generic"Generic Model"string to avoid any brand confusion.
- Fixed a bug where switches that do not explicitly report their model inside
- 🐳 Docker & Docker Compose Support:
- Implemented lightweight Docker containerization using a standard
Dockerfilebuilt onpython:3.11-slimand a unifieddocker-compose.yml.
- Implemented lightweight Docker containerization using a standard
- 💾 Unified Persistent Storage Mapping:
- Conserved configurations, notes, speed history, and backups inside a single
/datafolder inside the container mapped to a custom environment variableDASHBOARD_DATA_DIR.
- Conserved configurations, notes, speed history, and backups inside a single
- 🛡️ Auto-Initialization Safeguard:
- Automatically initializes volume directories with default configuration files upon startup if mapped to empty host folders to avoid container crash loops.
- 📦 Absolute Resource Pathing:
- Configured Flask absolute template and static directories dynamically to resolve relative directory conflicts inside Docker environments.
- 🎨 Administrative Port Contrast & Legend Integration:
- Outlined administratively disabled ports in the graphical representation using a unique, premium dark-grey (
#353c45) to distinguish them from standard offline ports (#57606a). - Integrated the new Disabled status label and color badge directly into the central
PORT STATUSlegend.
- Outlined administratively disabled ports in the graphical representation using a unique, premium dark-grey (
- 🔒 Administrative Port Status Scraping:
- Upgraded scraping engine to fetch
/port.cgiand parse active configuration states, accurately reportingDISABLEstatus instead of misleading physical link states.
- Upgraded scraping engine to fetch
- 🔄 Safe Device Reboot Modal:
- Implemented secure switch reboots via
/reboot.cgiwith an immersive glassmorphic warning modal to protect users from accidental network disruption.
- Implemented secure switch reboots via
- 💾 Configuration Backup Manager:
- Added on-demand server-side configuration backups (
.binfiles) with an interactive dashboard to download, view, and safely delete configurations.
- Added on-demand server-side configuration backups (
- 🟢 Snooping & Multicast Telemetry Integration:
- Integrated global and port-level status for DHCP Snooping, IGMP Snooping (with collapsible multicast table), and Jumbo Frame size properties.
- 🎨 Visual Color Harmonization:
- Aligned table port speed texts (
colonna speed) with matching port status indicators in the graphics bar.
- Aligned table port speed texts (
- 📋 Interactive API Reference Expansion:
- Documented reboot and backups endpoints in the interactive local
/api-docsinterface.
- Documented reboot and backups endpoints in the interactive local
Buy me a coffee