add hw on pandas #12
There are no files selected for viewing
This file contains hidden or bidirectional Unicode text that may be interpreted or compiled differently than what appears below. To review, open the file in an editor that reveals hidden Unicode characters.
Learn more about bidirectional Unicode characters
| Original file line number | Diff line number | Diff line change | ||||||||||||||||||||
|---|---|---|---|---|---|---|---|---|---|---|---|---|---|---|---|---|---|---|---|---|---|---|
| @@ -0,0 +1,149 @@ | ||||||||||||||||||||||
| import pandas as pd | ||||||||||||||||||||||
| import numpy as np | ||||||||||||||||||||||
| import seaborn as sns | ||||||||||||||||||||||
| import matplotlib.pyplot as plt | ||||||||||||||||||||||
|
|
||||||||||||||||||||||
|
|
||||||||||||||||||||||
| # read dataframe | ||||||||||||||||||||||
| df = pd.read_csv('../data/train.csv') | ||||||||||||||||||||||
|
|
||||||||||||||||||||||
| # Drawing histograms | ||||||||||||||||||||||
| sns.set() | ||||||||||||||||||||||
|
|
||||||||||||||||||||||
| fig, ax = plt.subplots(2, 2, figsize=(12, 10)) | ||||||||||||||||||||||
| fig.suptitle('Distributions nucleotides over positions in reads', fontsize=18) | ||||||||||||||||||||||
| ax[0, 0].hist(df['A'].dropna(), bins=30) | ||||||||||||||||||||||
| ax[0, 1].hist(df['C'].dropna(), bins=30) | ||||||||||||||||||||||
| ax[1, 0].hist(df['T'].dropna(), bins=30) | ||||||||||||||||||||||
| ax[1, 1].hist(df['G'].dropna(), bins=30) | ||||||||||||||||||||||
|
|
||||||||||||||||||||||
| ax[0, 0].set_title('A', fontsize=16) | ||||||||||||||||||||||
| ax[0, 1].set_title('C', fontsize=16) | ||||||||||||||||||||||
| ax[1, 0].set_title('T', fontsize=16) | ||||||||||||||||||||||
| ax[1, 1].set_title('G', fontsize=16) | ||||||||||||||||||||||
|
Comment on lines
+13
to
+23
There was a problem hiding this comment. Было бы удобно отобразить это на одном графике. Плохой вариант - наложенные гистограммы с прозрачностью. Более хороший - barplot с группировкой или stacked barplot |
||||||||||||||||||||||
|
|
||||||||||||||||||||||
|
|
||||||||||||||||||||||
| # Selecting special rows and cols | ||||||||||||||||||||||
| matches_mean = df.matches.mean() | ||||||||||||||||||||||
| df_subset = df.query('matches > @matches_mean') | ||||||||||||||||||||||
| df_subset = df_subset[['pos', 'reads_all', 'mismatches', 'deletions', 'insertions']] | ||||||||||||||||||||||
| df_subset.to_csv('../data/train_part.csv', index=False, sep=',') | ||||||||||||||||||||||
|
|
||||||||||||||||||||||
|
|
||||||||||||||||||||||
| # Read dataframe with pokemons | ||||||||||||||||||||||
| pokemons_df = pd.read_csv('../data/Pokemon.csv') | ||||||||||||||||||||||
|
|
||||||||||||||||||||||
| # Show general info about dataframe | ||||||||||||||||||||||
| pokemons_df.info() | ||||||||||||||||||||||
|
|
||||||||||||||||||||||
| # Renaming columns | ||||||||||||||||||||||
| new_columns = {'#': 'Id', 'Type 1': 'Type_1', 'Type 2': 'Type_2', 'Sp. Atk': 'Sp_atk', 'Sp. Def': 'Sp_def'} | ||||||||||||||||||||||
| pokemons_df.rename(columns=new_columns, inplace=True) | ||||||||||||||||||||||
|
|
||||||||||||||||||||||
| # Checking for missing values | ||||||||||||||||||||||
| print('Не стоит беспокоиться об NA') if pokemons_df.count().min() == pokemons_df.shape[0] else print('Oops!') | ||||||||||||||||||||||
|
|
||||||||||||||||||||||
| plt.figure(figsize=(10, 8)) | ||||||||||||||||||||||
| plt.title('Heatmap of NA values in dataframe', fontsize=18) | ||||||||||||||||||||||
| sns.heatmap(pokemons_df.isna()) | ||||||||||||||||||||||
| plt.xticks(fontsize=14) | ||||||||||||||||||||||
|
|
||||||||||||||||||||||
| print('\tПеременная\tПроцент NA') | ||||||||||||||||||||||
| print('---------------------------------------') | ||||||||||||||||||||||
| for col in pokemons_df.columns: | ||||||||||||||||||||||
| percentage = pokemons_df[col].isna().mean()*100 | ||||||||||||||||||||||
| if percentage == 0: | ||||||||||||||||||||||
| percentage = int(percentage) | ||||||||||||||||||||||
| else: | ||||||||||||||||||||||
| percentage = round(percentage, 2) | ||||||||||||||||||||||
| print('{:>14} {:>14} %'.format(col, percentage)) | ||||||||||||||||||||||
|
|
||||||||||||||||||||||
| # Plotting Type 1 and Type 2 classes | ||||||||||||||||||||||
| plt.figure(figsize=(15, 8)) | ||||||||||||||||||||||
| plt.subplot(1, 2, 1) | ||||||||||||||||||||||
| sns.countplot(pokemons_df['Type_1']) | ||||||||||||||||||||||
| plt.title('Type 1 classes', fontsize=18) | ||||||||||||||||||||||
| plt.xlabel('Type 1', fontsize=14) | ||||||||||||||||||||||
| plt.ylabel('Count', fontsize=14) | ||||||||||||||||||||||
| plt.xticks(rotation=90) | ||||||||||||||||||||||
|
|
||||||||||||||||||||||
| plt.subplot(1, 2, 2) | ||||||||||||||||||||||
| sns.countplot(pokemons_df['Type_2']) | ||||||||||||||||||||||
| plt.title('Type 2 classes', fontsize=18) | ||||||||||||||||||||||
| plt.xlabel('Type 2', fontsize=14) | ||||||||||||||||||||||
| plt.ylabel('Count', fontsize=14) | ||||||||||||||||||||||
| plt.xticks(rotation=90) | ||||||||||||||||||||||
|
|
||||||||||||||||||||||
| # Plotting Generation and Legendary classes | ||||||||||||||||||||||
| plt.figure(figsize=(15, 8)) | ||||||||||||||||||||||
| plt.subplot(1, 2, 1) | ||||||||||||||||||||||
| sns.countplot(pokemons_df.Generation) | ||||||||||||||||||||||
| plt.xlabel('Generation', fontsize=14) | ||||||||||||||||||||||
| plt.ylabel('count', fontsize=14) | ||||||||||||||||||||||
| plt.xticks(fontsize=14) | ||||||||||||||||||||||
| plt.yticks(fontsize=14) | ||||||||||||||||||||||
|
|
||||||||||||||||||||||
| plt.subplot(1, 2, 2) | ||||||||||||||||||||||
| sns.countplot(pokemons_df.Legendary) | ||||||||||||||||||||||
| plt.xlabel('Legendary', fontsize=14) | ||||||||||||||||||||||
| plt.ylabel('count', fontsize=14) | ||||||||||||||||||||||
| plt.xticks(fontsize=14) | ||||||||||||||||||||||
| plt.yticks(fontsize=14) | ||||||||||||||||||||||
|
|
||||||||||||||||||||||
| # Plotting pair plots for numeric features | ||||||||||||||||||||||
| numeric_cols = ['Total', 'HP', 'Attack', 'Defense', 'Sp_atk', 'Sp_def', 'Speed'] | ||||||||||||||||||||||
| sns.pairplot(pokemons_df[numeric_cols]) | ||||||||||||||||||||||
|
|
||||||||||||||||||||||
| # Plotting boxplots for numeric features | ||||||||||||||||||||||
| plt.figure(figsize=(18, 10)) | ||||||||||||||||||||||
| for i, col in enumerate(numeric_cols): | ||||||||||||||||||||||
| plt.subplot(2, 4, i+1) | ||||||||||||||||||||||
| sns.boxplot(pokemons_df[col]) | ||||||||||||||||||||||
|
|
||||||||||||||||||||||
| # Plotting Pearson correlation heatmap for numeric features | ||||||||||||||||||||||
| plt.figure(figsize=(10, 8)) | ||||||||||||||||||||||
| sns.heatmap(pokemons_df[numeric_cols].corr(), annot=True) | ||||||||||||||||||||||
| plt.title('Pearson correlation', fontsize=18) | ||||||||||||||||||||||
| plt.xticks(fontsize=14) | ||||||||||||||||||||||
| plt.yticks(fontsize=14) | ||||||||||||||||||||||
|
|
||||||||||||||||||||||
|
|
||||||||||||||||||||||
| # functions for reading gff and bed formats | ||||||||||||||||||||||
| def read_gff(path_to_file): | ||||||||||||||||||||||
| rrna_annotation_df = pd.read_csv(path_to_file, header=1, sep='\t') | ||||||||||||||||||||||
| rrna_annotation_df = pd.DataFrame(np.r_[np.array(rrna_annotation_df.columns)[np.newaxis, :], | ||||||||||||||||||||||
| rrna_annotation_df.values]) | ||||||||||||||||||||||
| rrna_annotation_df.columns = ['chromosome', 'source', 'type', 'start', 'end', | ||||||||||||||||||||||
| 'score', 'strand', 'phase', 'attributes'] | ||||||||||||||||||||||
| rrna_annotation_df[['start', 'end']] = rrna_annotation_df[['start', 'end']].astype(int) | ||||||||||||||||||||||
| rrna_annotation_df['score'] = rrna_annotation_df['score'].astype(float) | ||||||||||||||||||||||
|
Comment on lines
+113
to
+119
There was a problem hiding this comment. Я не совсем понял к чему весь этот огород с индексами. Чтобы убрать комменты?
Suggested change
|
||||||||||||||||||||||
|
|
||||||||||||||||||||||
| return rrna_annotation_df | ||||||||||||||||||||||
|
|
||||||||||||||||||||||
|
|
||||||||||||||||||||||
| def read_bed6(path_to_file): | ||||||||||||||||||||||
| alignment_bed_df = pd.read_csv(path_to_file, sep='\t', header=None) | ||||||||||||||||||||||
| alignment_bed_df.columns = ['chromosome', 'start', 'end', 'name', 'score', 'strand'] | ||||||||||||||||||||||
| return alignment_bed_df | ||||||||||||||||||||||
|
|
||||||||||||||||||||||
|
|
||||||||||||||||||||||
| # creating new column with RNA type | ||||||||||||||||||||||
| rrna_annotation_df = read_gff('../data/rrna_annotation.gff') | ||||||||||||||||||||||
| rrna_annotation_df['rna_type'] = rrna_annotation_df.attributes.apply(lambda x: x.split('=')[1].split('_')[0]) | ||||||||||||||||||||||
|
|
||||||||||||||||||||||
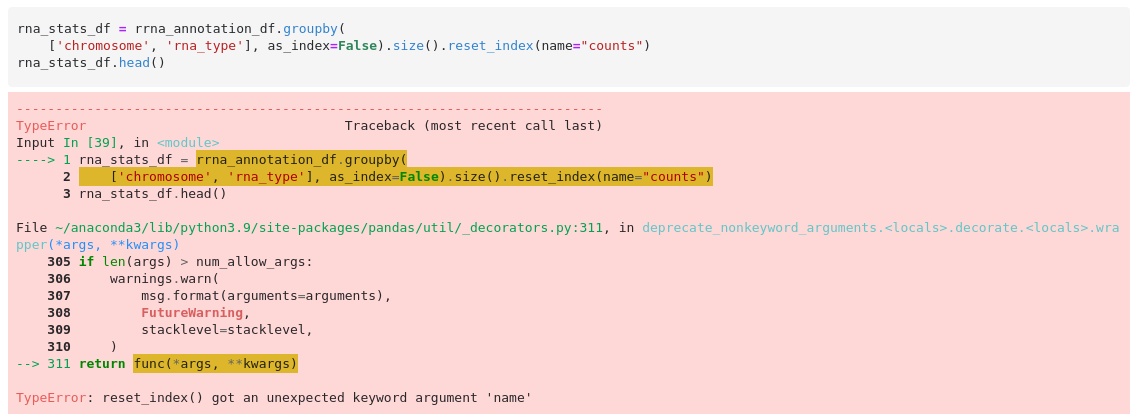
| # collecting statistics on rna types in each chromosome | ||||||||||||||||||||||
| rna_stats_df = rrna_annotation_df.groupby( | ||||||||||||||||||||||
| ['chromosome', 'rna_type'], as_index=False).size().reset_index(name='counts') | ||||||||||||||||||||||
|
Comment on lines
+135
to
+136
There was a problem hiding this comment.
Мб дело в версии пандаса, но я проверить не мог, так как список зависимостей не указан) |
||||||||||||||||||||||
|
|
||||||||||||||||||||||
| # plotting barplot for different RNAs on each chromosome | ||||||||||||||||||||||
| plt.figure(figsize=(12, 10)) | ||||||||||||||||||||||
| sns.barplot(x='counts', y='chromosome', hue='rna_type', data=rna_stats_df) | ||||||||||||||||||||||
|
|
||||||||||||||||||||||
| # reading bed file | ||||||||||||||||||||||
| alignment_bed_df = read_bed6('../data/alignment.bed') | ||||||||||||||||||||||
|
|
||||||||||||||||||||||
| # intersection (analogue of bedtools intersect command) | ||||||||||||||||||||||
| df_intersected = rrna_annotation_df.merge(alignment_bed_df, on=['chromosome'], how='inner') | ||||||||||||||||||||||
| is_inside = df_intersected[['start_x', 'end_x', 'start_y', 'end_y']].apply( | ||||||||||||||||||||||
| lambda x: x[0] > x[2] and x[1] < x[3], axis=1) | ||||||||||||||||||||||
|
Comment on lines
+147
to
+148
There was a problem hiding this comment. Можно было просто сделать сравнения между колонками, но так тоже можно |
||||||||||||||||||||||
| df_intersected = df_intersected[is_inside] | ||||||||||||||||||||||
Oops, something went wrong.
Add this suggestion to a batch that can be applied as a single commit.
This suggestion is invalid because no changes were made to the code.
Suggestions cannot be applied while the pull request is closed.
Suggestions cannot be applied while viewing a subset of changes.
Only one suggestion per line can be applied in a batch.
Add this suggestion to a batch that can be applied as a single commit.
Applying suggestions on deleted lines is not supported.
You must change the existing code in this line in order to create a valid suggestion.
Outdated suggestions cannot be applied.
This suggestion has been applied or marked resolved.
Suggestions cannot be applied from pending reviews.
Suggestions cannot be applied on multi-line comments.
Suggestions cannot be applied while the pull request is queued to merge.
Suggestion cannot be applied right now. Please check back later.
There was a problem hiding this comment.
Choose a reason for hiding this comment
The reason will be displayed to describe this comment to others. Learn more.
Пути к файлам лучше всегда указывать через
os.path.join