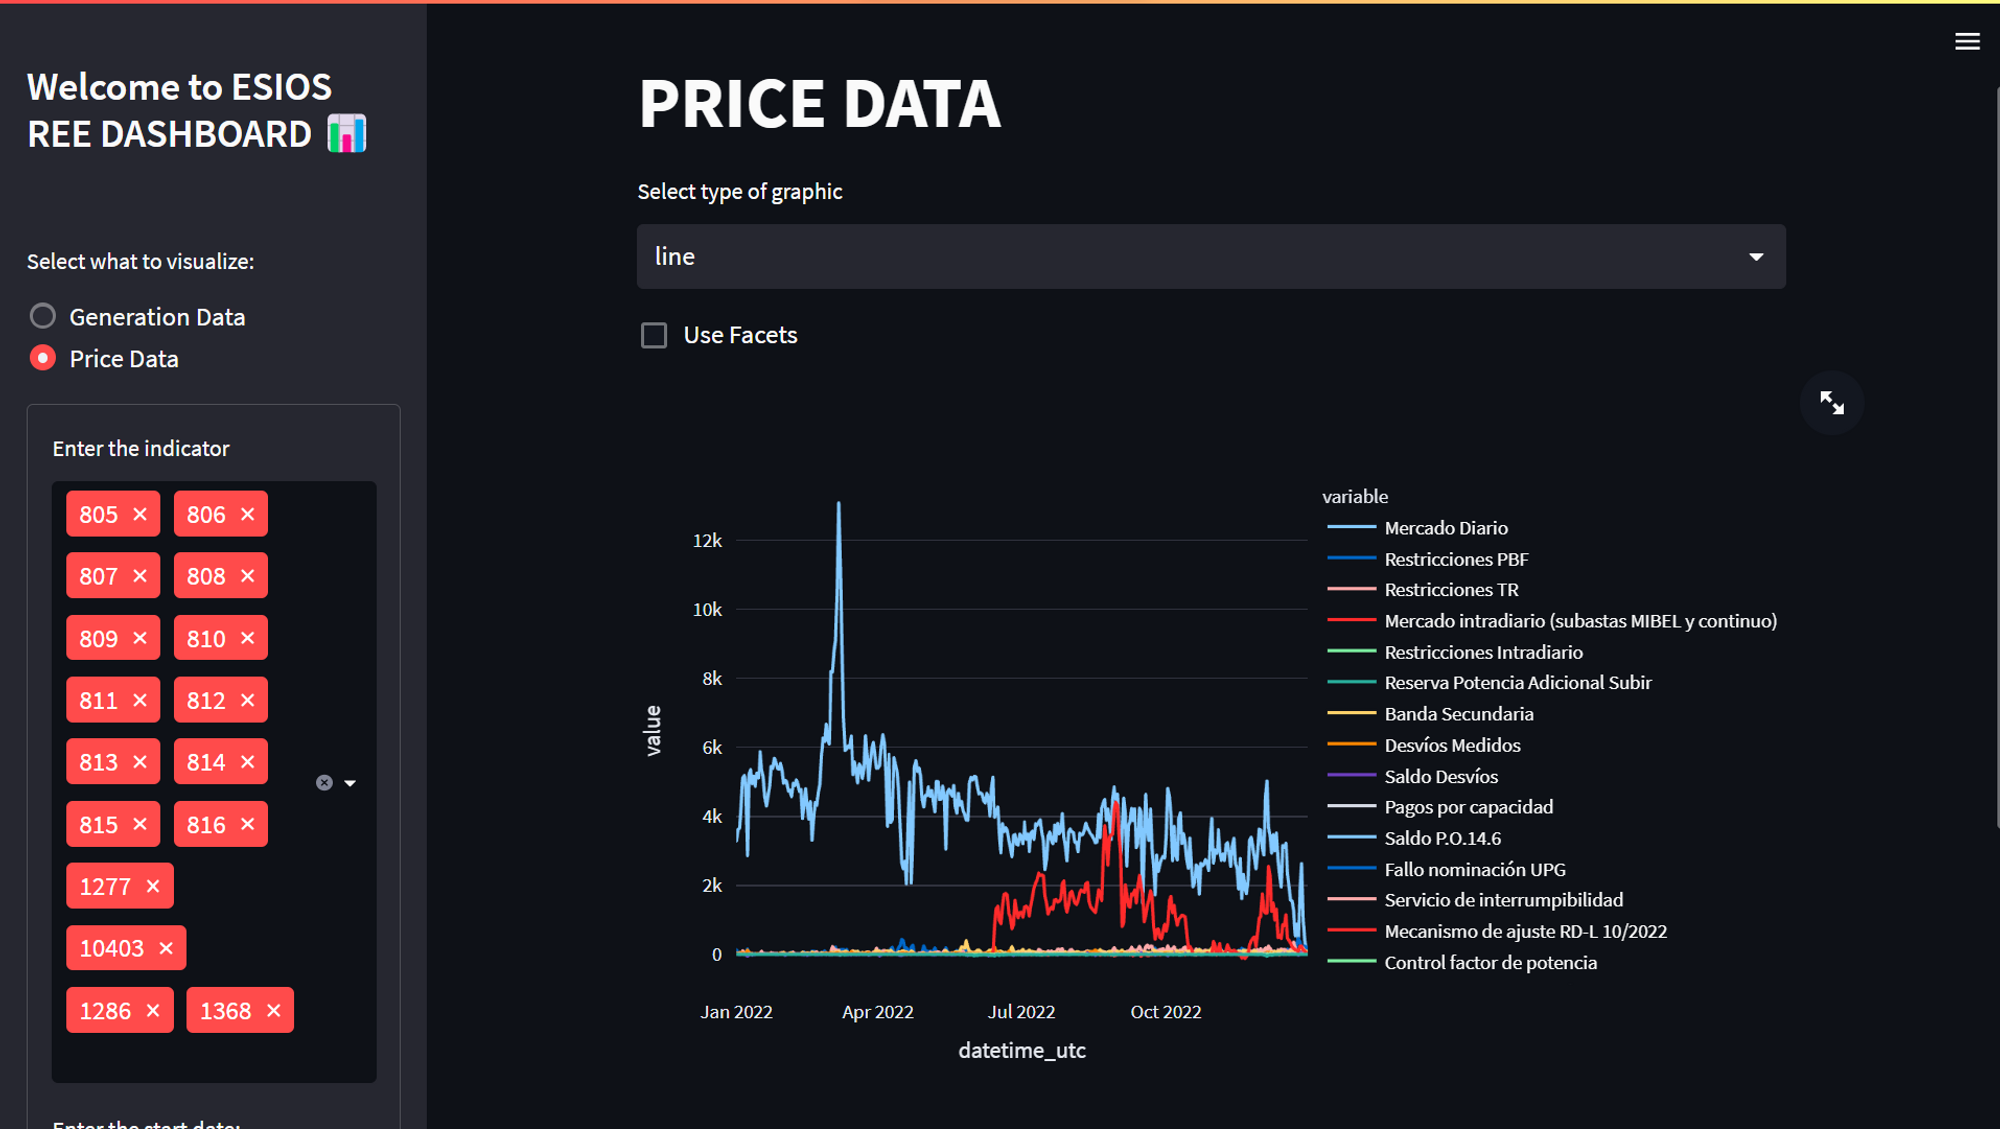
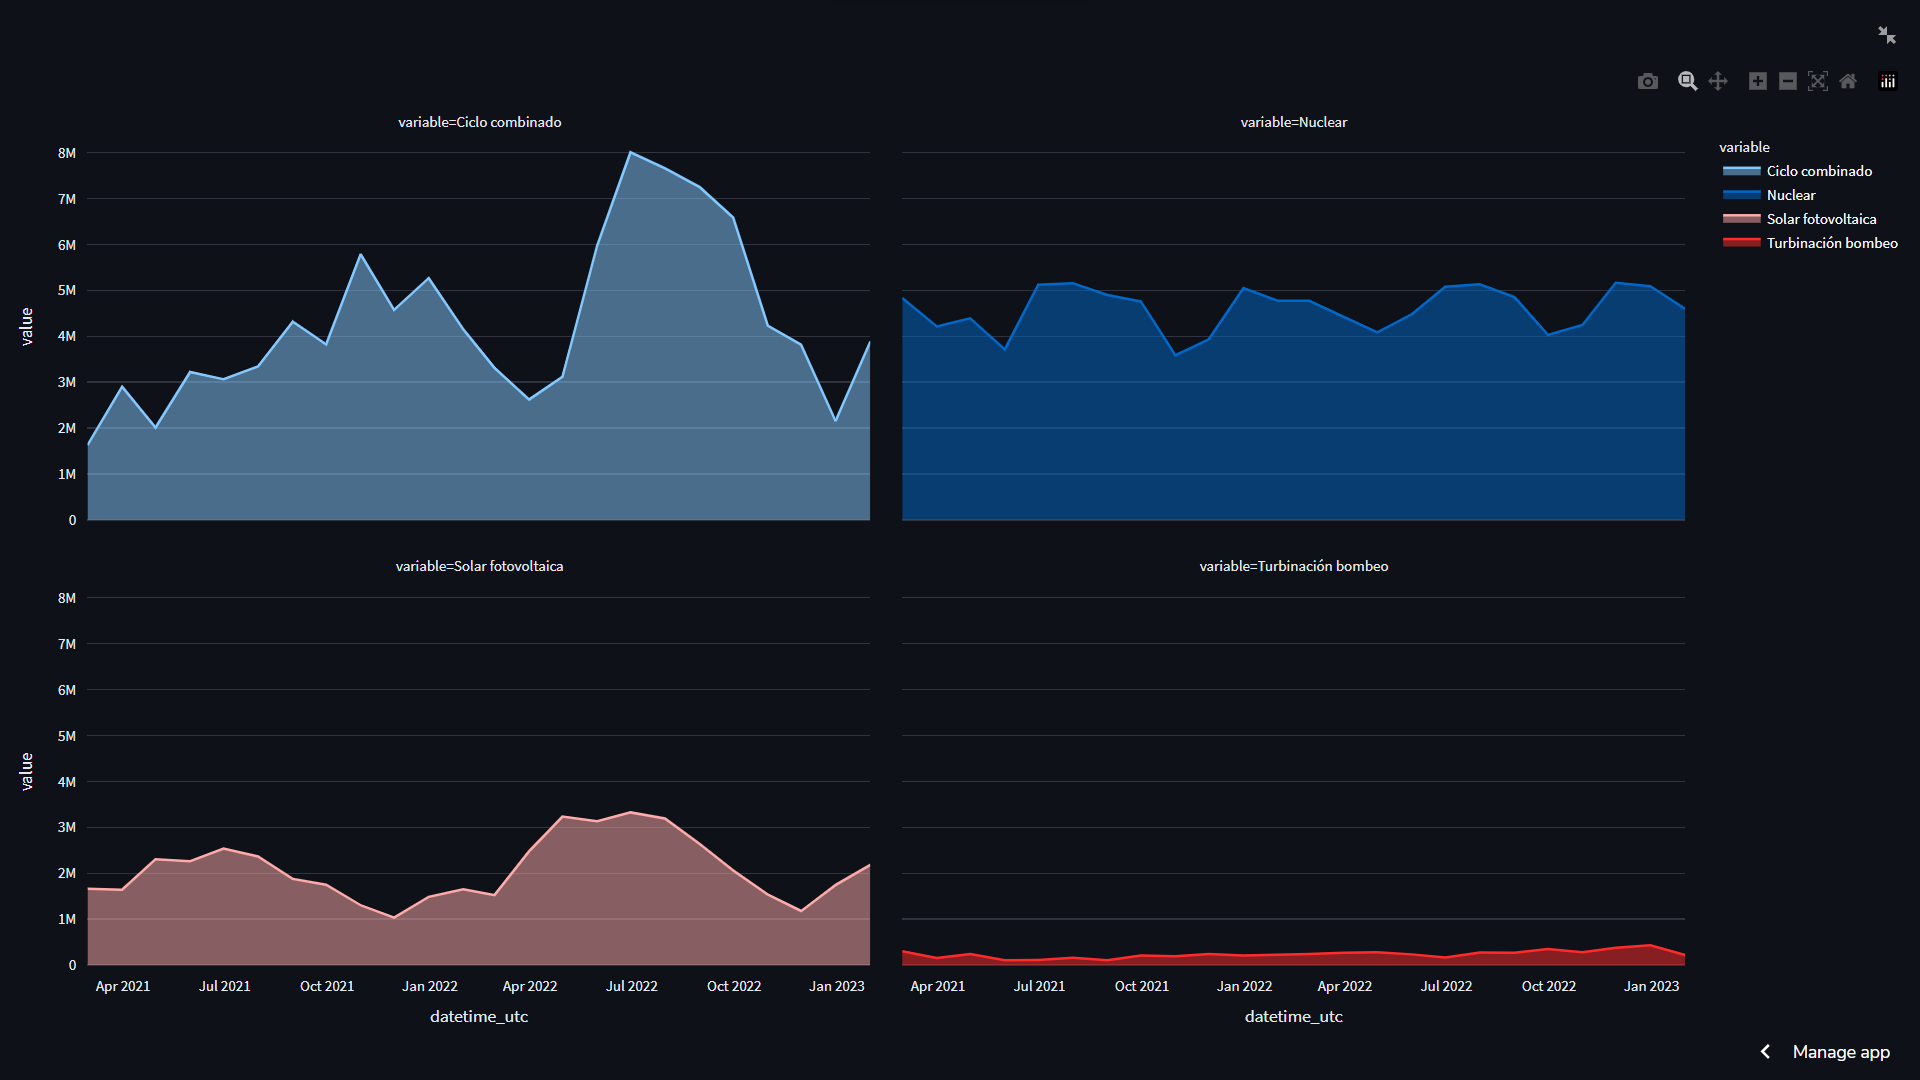
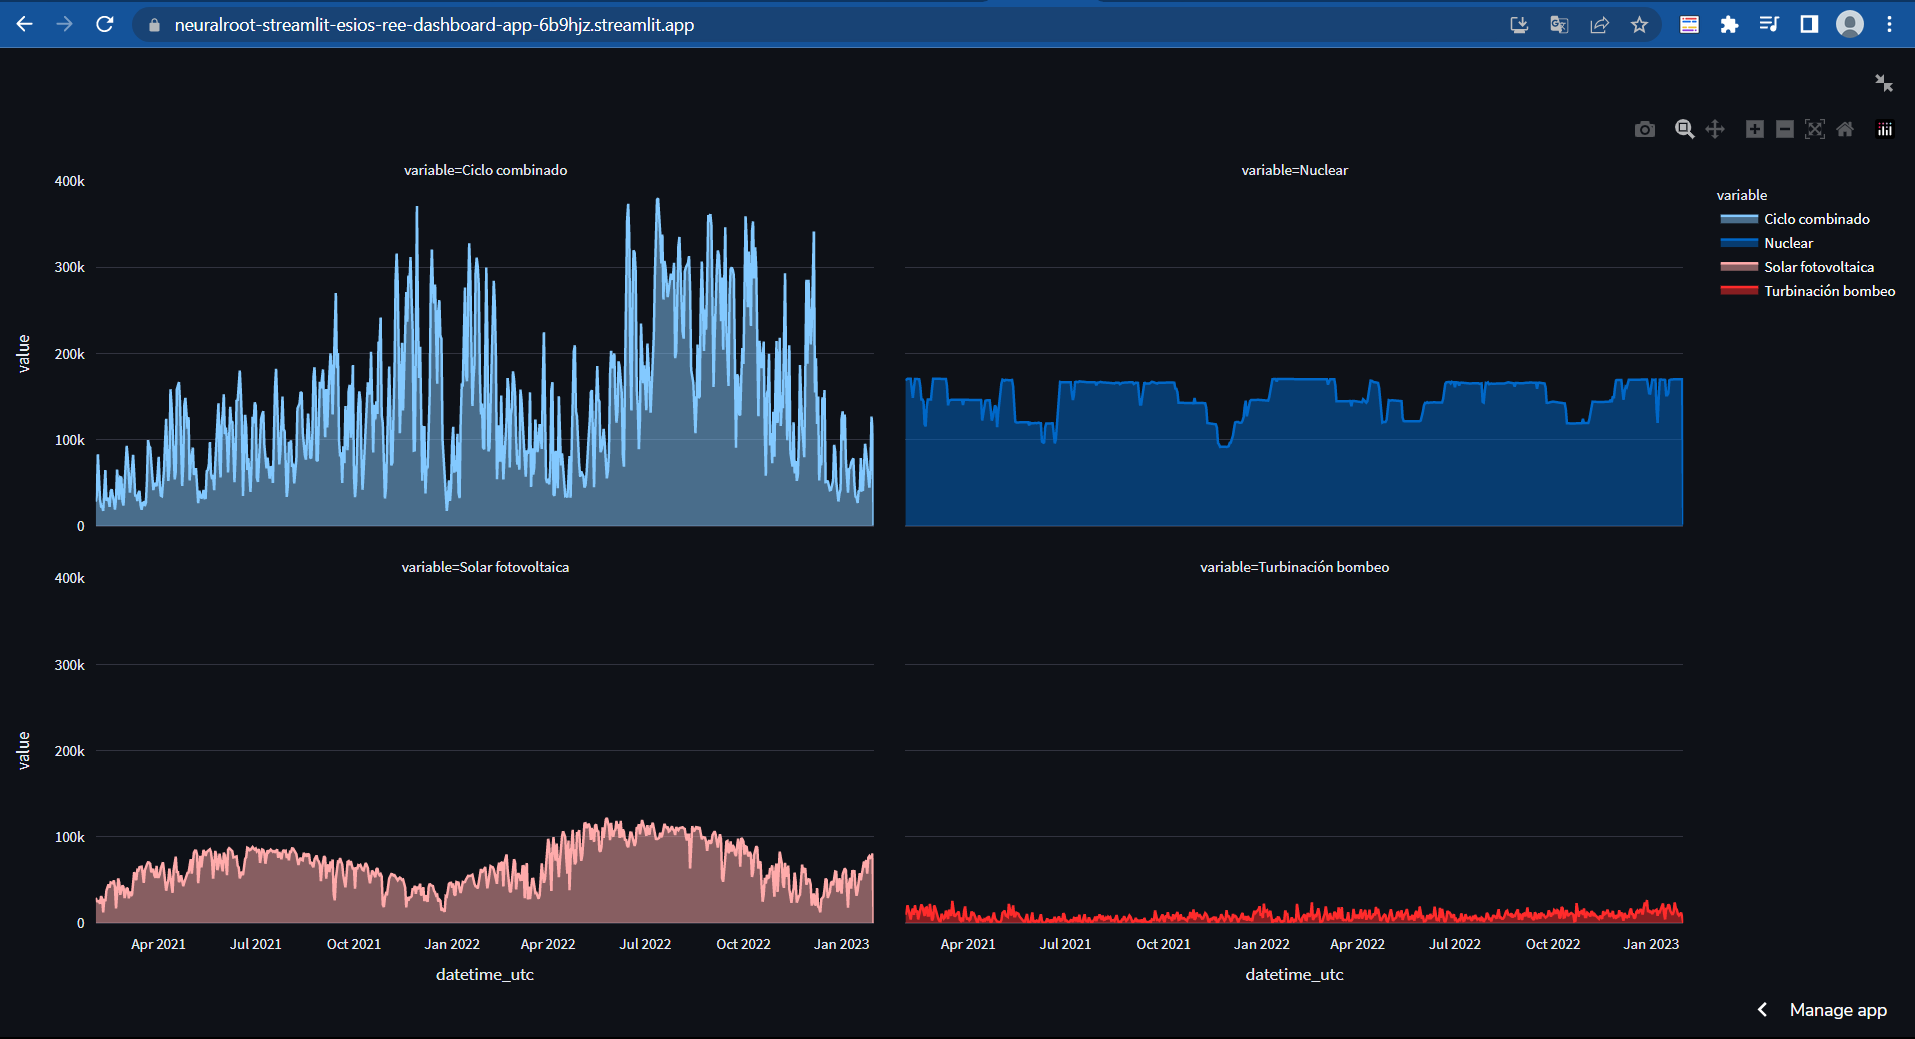
- This web app visualize any indicator from ESIOS API, (electric generation data or price data) of Spain
- Create a virtual enviromment using
conda create -n streamlit_app, and then doconda activate streamlit_app - Replace the token value in
credentials.jsonwith your own ESIOS token, can be owned here - Pip install -r requirements.txt
- Then, move to the
root folder, and do streamlit run app.py