Affinity scores provide a quantitative measure of the strength of relationships between inputs (such as entities, locations, or preferences) and their most relevant outputs. They adapt to various contexts like entity recommendations, geospatial insights, or taste analysis. They range from 0 to 100 and are expressed as a percentage:
- 0 indicates no correlation.
- 100 represents a perfect match.
The interpretation of an affinity score varies depending on the context:
- Basic Insights: Measures how similar one entity is to another. A high score means the two entities are highly similar (determined by the cosine similarity of their embeddings).
Example: Exploring how similar two music artists are based on the preferences and behaviors of their shared audience.
- Location Insights: Evaluates the significance of an entity in a specific location compared to other entities in that location. A high score indicates that an entity is particularly relevant to a specific location compared to others in that region and globally.
Example: Understanding how well a restaurant appeals to diners in one neighborhood versus another.
- Taste Analysis: Breaks down a list of entities (called a "taste vector") into descriptive tags that capture key characteristics or themes. The score represents the relevance of tags to a taste vector, with higher scores indicating stronger correlation.
Example: A list of movies might generate tags like "action-packed," "award-winning," or "family-friendly," capturing key characteristics of the preferences of users who favor the input movies.
Check out our FAQs.
To help interpret the significance of an affinity score, we categorize the ranges as follows:
| Affinity Score Range | Relevance | Example |
|---|---|---|
| > 80 | Very High | Chappell Roan and Sabrina Carpenter for a music artist query. |
| 60 – 80 | High | A local bakery and Dunkin' Donuts for a places query. |
| = 50 | Medium | A sushi restaurant and a library for a places query. |
| < 50 | Low | Chappell Roan and a historical landmark for a music artist query. |
Affinity scores may decrease as more inputs or filters are applied. For example, a score of 55 could still represent a strong recommendation, but including demographic data may lower the final score. Consider the context and input complexity when evaluating scores.
It's common to see multiple results with High or Very High affinity scores, especially when the input is broad or strongly defined. This typically indicates that the system has identified a cluster of strong matches, each highly relevant to the input criteria. These are often the top-ranked entities out of thousands of possibilities, and all may be viable depending on your use case.
Affinity scores should be interpreted in context. A slight difference, like 91 versus 92, usually indicates similar relevance. Larger gaps indicate more pronounced differences in the strength of entity connections. In most cases, minor score differences reflect similar relevance and are best evaluated alongside the order in which results appear.
The affinity score measures the strength of relationships between entities, such as audiences, interests, or locations. When you submit a query, the index provides a quick and meaningful way to assess relevance by ranking results based on their affinity scores.
For example, in response to the query, "What are the most popular music artists for people living in NYC?", artists are assigned an index based on their scores. Even if two artists have similar scores, like 92 and 91, the index reflects their relative position in the results. A lower index means higher relevance.
Affinity scores can help identify brand partners or collaborators that best align with your target audience's tastes and values.
- Focus on the top-ranked results, especially those labeled as High or Very High affinity.
- Use filters to reflect your campaign's intended audience segment, such as demographics, interests, or location.
- Because scores are normalized per query, compare brands based on their relative position in the results, not just the raw score.
- Use tags to evaluate shared traits, such as sustainability, regional popularity, or lifestyle themes.
When several brands rank highly, prioritize based on audience fit and strategic alignment, rather than focusing on slight differences in scores.
Starting off with a perfect match, see the nuance of how the results evolve as more modifiers are added. Let's say you start off simply wanting to know which music artist is most strongly correlated to New York City.
To pose your question, you adjust the base query and add a table to your dashboard:
Base Query: Anyone from New York that likes Anything
Entity Correlations Table: Category is Music Artists
The system calculates affinity scores for all artists based on their relevance to audiences in NYC.
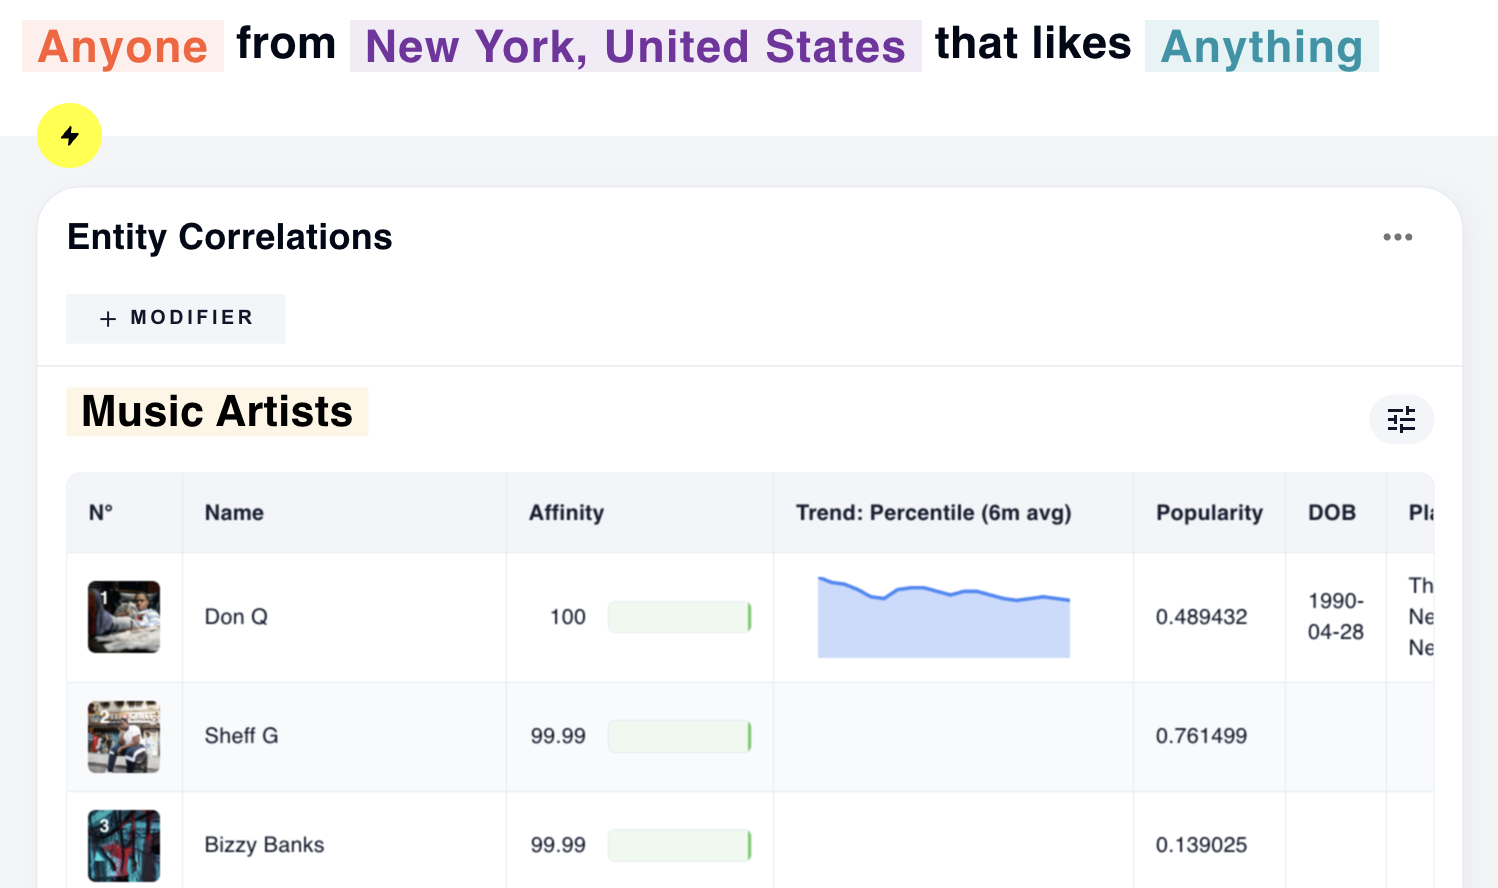
Don Q's perfect score reflects their strong affinity among NYC audiences.
You add a gender and age selection to your base query input to see the differences between the preferences of NYC audiences as a whole versus women in a certain age range.
Base Query: Women aged 25-34 from New York that like Anything
Entity Correlations Panel: Category is Music Artists
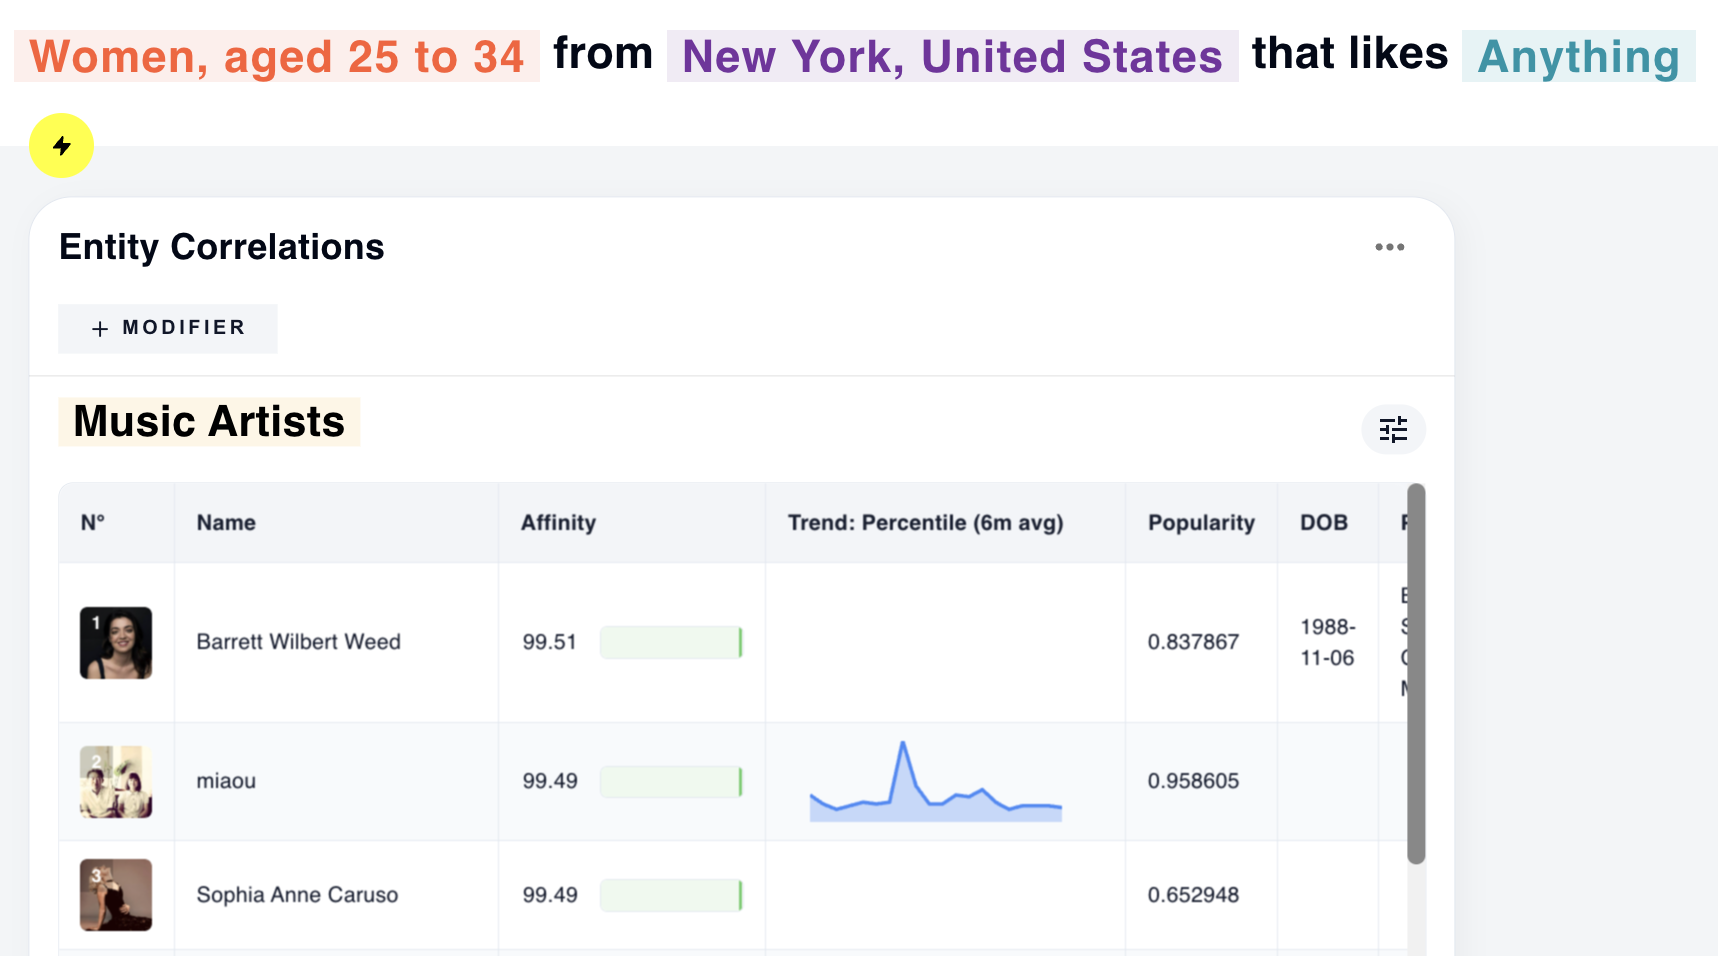
As the preferences of women aged 25-34 shift the results, the strongest match for this demographic has an affinity of 99.51%, as well as a strong popularity score.
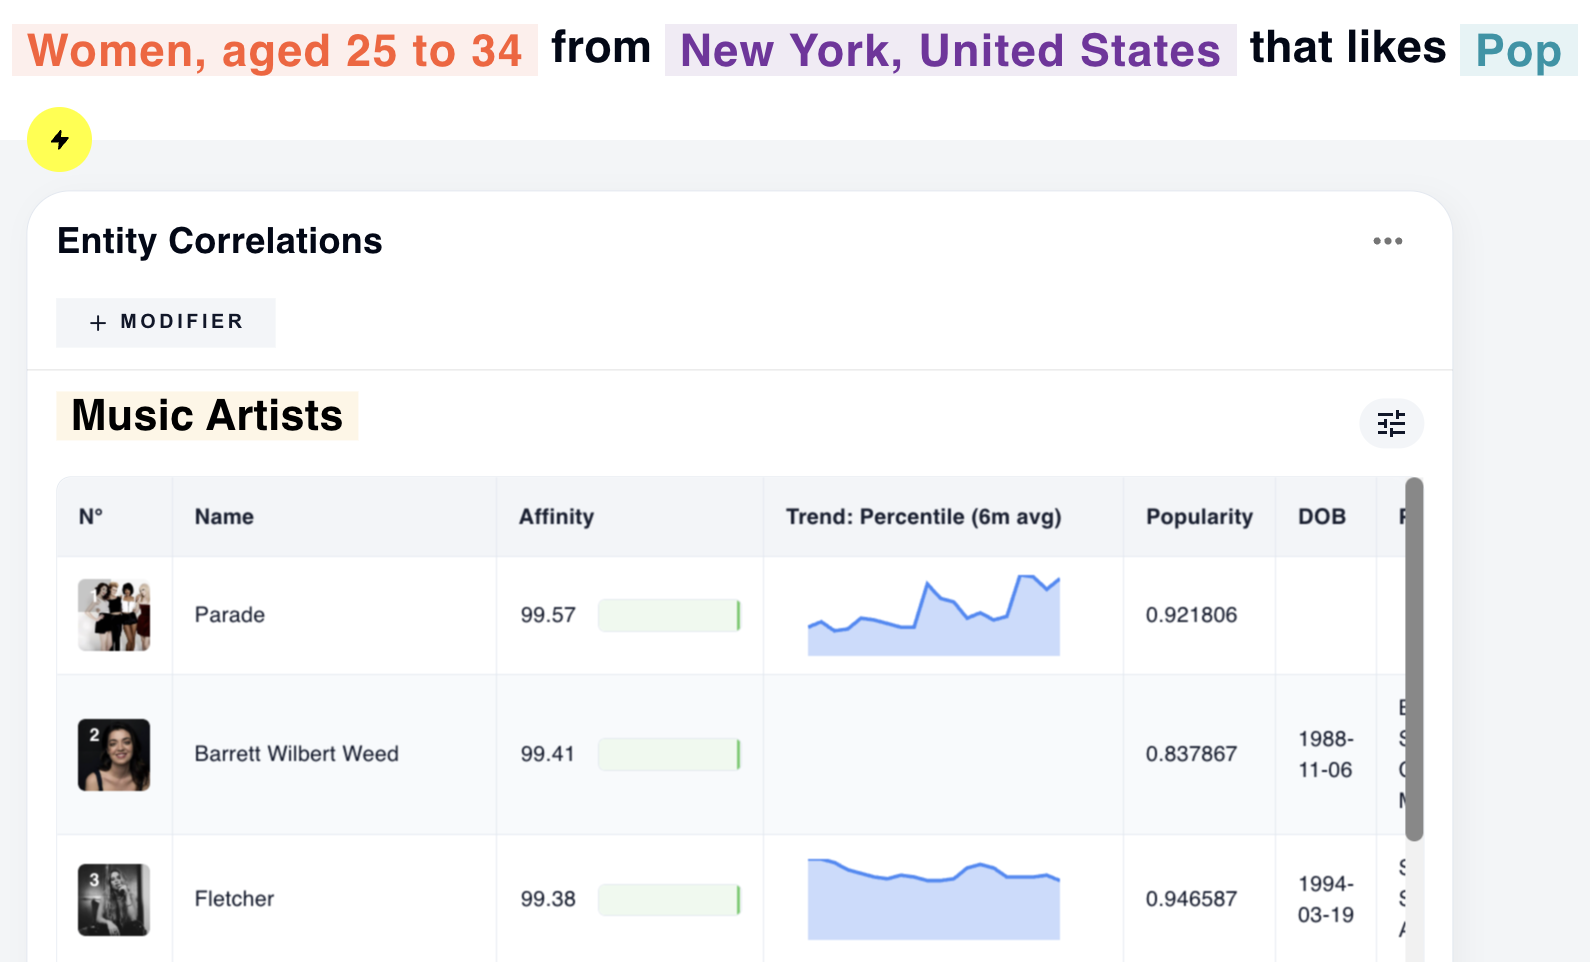
To filter the results to pop artists and ignore more niche music genres, you add "Pop" to the base query as an interest. The system now considers only pop artists for this audience.
Base Query: Women aged 25-34 from New York that like Pop
Entity Correlations Panel: Category is Music Artists
Base Query: Women aged 25-34 from SoHo, New York that like Pop
Entity Correlations Panel: Category is Music Artists
Lastly, you want to limit the results to reflect the tastes of women living in SoHo only.
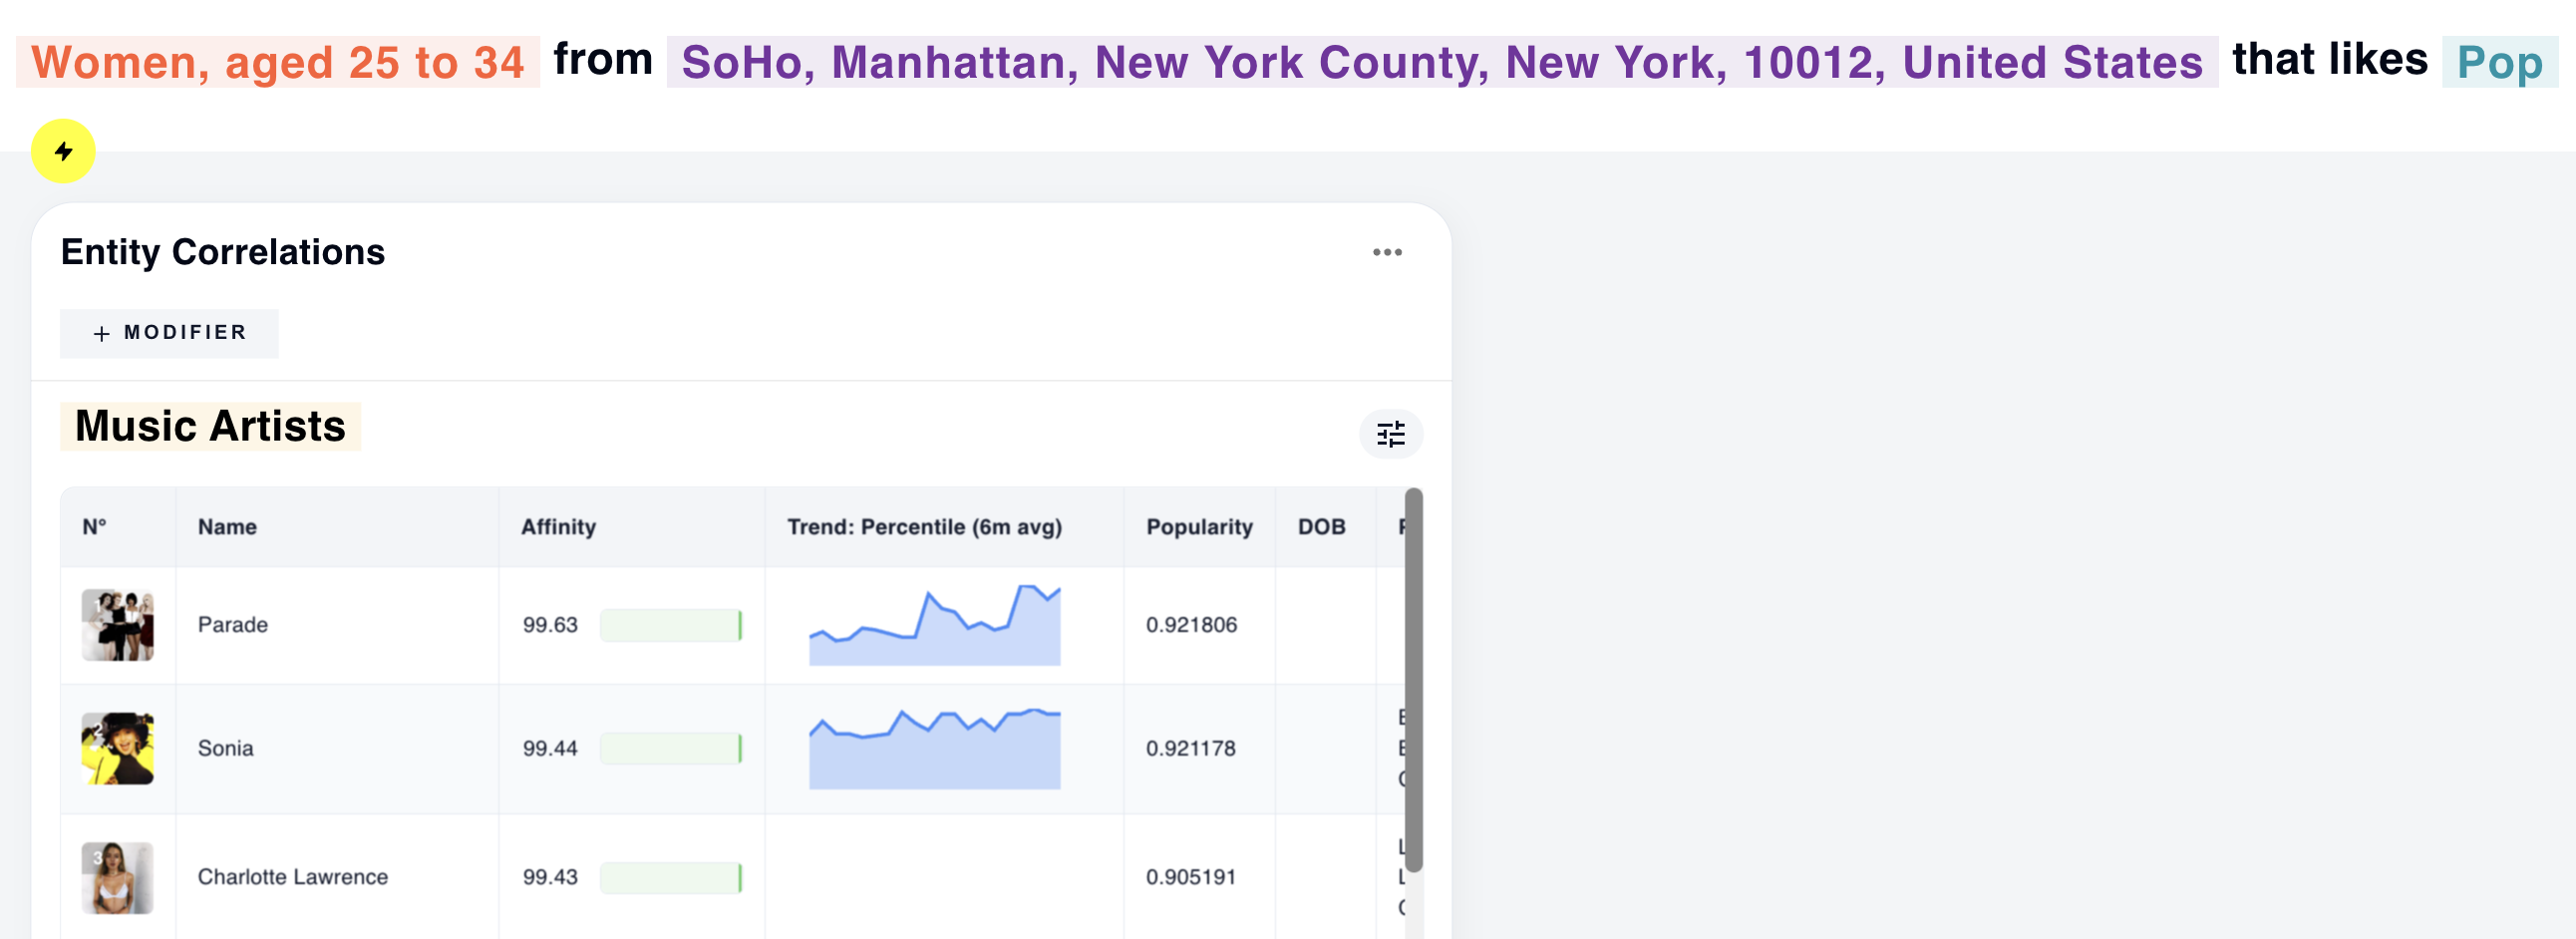
The system adjusts the affinity scores to reflect the preferences of SoHo audiences specifically.
This example demonstrates how affinity scores and ranking of results adapt as you refine a query, offering nuanced insights into audience preferences. By starting with broad relevance and progressively narrowing the focus, the system highlights connections that align with specific criteria, like demographic, genre, and location.