This guide covers the following UI actions and components:
-
Dashboard Actions: Manage and edit your dashboards.
-
Create Insights: Components used for generating an insight.
- Base Query: Options for setting the base query.
-
Panels: Manage and edit different panel types.
- Heatmap Panels: Options for fine-tuning heatmap panels.
-
Tabs: View and switch between open dashboard tabs.
-
Comments: Create and manage detailed comments.
-
You can manage your dashboards from the home page or from the individual dashboard page.
| Action | Description |
|---|---|
| New Dashboard | Create a new dashboard: - From the home page: Click the blue "New Dashboard" button on the top right of the screen - From a dashboard: Click the blue "+" button on the top left of the screen > Click "Create a New Dashboard" |
| Favorite | Favorite a dashboard to easily identify it when browsing all your dashboards on the home page: - From "Recents" on the home page: Click the star icon on the left side of the dashboard title. - From a dashboard: Click the three-dot menu to the right of the base query and click "Favorite" |
| Share | Share dashboards with other Insights users in your organization. |
| Rename Dashboard | Create a new title for your dashboard. |
| Clone Dashboard | Create a copy of a dashboard. |
| Delete Dashboard | Delete a dashboard. |
| Dark Mode | Toggle between light and dark mode by clicking on the sun icon on the top right of the screen. |
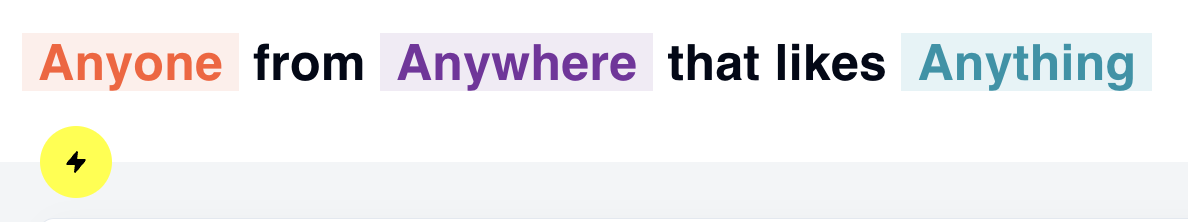
Base query and lightning icon for "New Insight"
| Action | Description |
|---|---|
| Search | Use the search bar on the top right to search for any entity (or tag) in our catalog. |
| Base Query | Use the base query prompt to select demographic filters, location data, and entity preferences that will apply to all panels on the open dashboard. |
| Lighting icon | Click the lightning icon to create a new Insights panel (an entity correlations table or heatmap). |
| Modify panel query | To add additional filters and entities to a specific panel, click the black "+ Modifier" button at the top of the panel. |
Modify the base query for all panels using the following options:
| Actions | Description |
|---|---|
| Anyone | Select demographic data, like the age of your target audience. |
| Anywhere | Select a location to narrow your results to users in a specific area. |
| Anything | Select an entity, such as a brand or restaurant. |
When you click the "New Insight" button, it creates a new panel with either entity correlations or a heatmap. You can drag and drop panels to arrange and organize them on the dashboard.
The following options are available through the three-dot menu on the top right of a panel:
| Action | Description |
|---|---|
| Clone Panel | Create a copy of the panel. |
| Open in request browser | Open the same panel data in the Request feature instead. |
| Delete Panel | Delete the panel. |

Screenshot of heatmap panel options: Toggle the icons and adjust the sliders
Toggle the icons to select which metric you want to prioritize in your heatmap results:
| Action | Description |
|---|---|
| Affinity Score | Click this button to display heatmap results that account only for affinity score. This measures how well an entity (like a brand or product) performs compared to itself in the area of interest. Areas where the entity's affinity score is above the median (50) are shown in red, while those below the median are shown in blue. This helps visualize where the entity is performing better or worse across different regions. |
| Popularity Score | Click this button to display heatmap results that account only for popularity. This indicates the popularity of an entity within a specific area by comparing it to other entities in the same location. When the entity's popularity score is above the median (.5), the area will be shown in red, highlighting where it has a stronger presence compared to other entities in that location. |
| Affinity Score by Location | Click this button to display heatmap results that account only for affinity rank. This compares an entity to other entities within a geographic location, both locally and globally. The affinity score provides a normalized measure of how much interest people in a specific location have in an entity, compared to other entities with signals in that area. This helps assess the relative level of interest across different locations from both a local and broader perspective. |
| Action | Description |
|---|---|
| Temperature | Use the first slider to adjust the temperature of the heatmap. This allows you to add visual definition when there is high density on the map. |
| Opacity | Use the second slider to adjust the opacity and see the map underneath the heatmap visuals. |
Quickly switch between multiple dashboards using the tabs at the top of the page.
| Action | Description |
|---|---|
| View open tabs | - From the home page: Click the blue "View my open tabs" button on the top right. - From a dashboard: Toggle between open tabs at the top of the screen, above the base query. |
| Open another tab | From a dashboard: Click the "+" button on the left of the screen and select an existing dashboard or create a new one. |
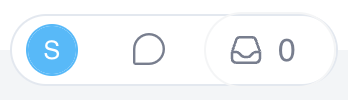
Comments menu: comment icon and inbox icon
You can leave comments anywhere on the dashboard. Click the comment icon in the top right menu to create a new comment, then drag and drop the comment pin to your desired location.
| Action | Description |
|---|---|
| Assign comment | Assign a comment to someone so they receive a notification about your comment. |
| Delete thread | Delete a comment thread. |
| Copy link | Copy a link that directly opens and expands the comment on the correct dashboard. |
| Resolve | Remove the comment pin from the dashboard while saving it in the comment panel for reference. |
| Add Emoji | Add an emoji to your comment. |
| Tag a user | Mention another user in the comment |
| Attach files | Upload a file from your computer to include in the comment. |
| Record voice | Record a voice note to include in your comment. |
| Record video | Record a video to include in your comment. |
| Record screen | Record a video of your screen to include in your comment. |
| Action | Description |
|---|---|
| View Comment | Click on a comment bubble to expand the pinned comment. |
| View All Comments | Click on the inbox icon on the comments menu to expand the comments panel. Here, you can view, search, filter, and manage all your comment threads. |